Stock Analysis · Flywire Corp (FLYW)
Overview
Flywire Corp is a payments software company focused on complex, high-value transactions, especially those that often cross borders and involve currency conversion, compliance checks, or reconciliation work. Instead of being a general consumer payments app, Flywire provides a platform that helps institutions and businesses collect payments, route funds, match payments with invoices or student accounts, and simplify the back-office work that comes after the payment is made.
The company organizes its business around industry verticals rather than geography alone. Its best-known activity is in education, where schools and universities use Flywire to collect tuition and other student-related payments from around the world. It also serves healthcare organizations, travel businesses, and a broader B2B category for enterprise payments. Revenue mainly comes from transaction-based fees tied to payment volume, with additional contribution from software and platform-related services.
Based on the latest annual mix described by the company, revenue is spread across several end markets:
- Education: about 40% to 45% — tuition, housing, and other school-related payments, particularly international student flows.
- Travel: about 25% to 30% — payments for tour operators, destination management companies, and other travel merchants handling larger, more complex bookings.
- Healthcare: about 15% to 20% — patient payments and related administrative workflows for hospitals and healthcare providers.
- B2B and other: about 10% to 15% — supplier, business, and cross-border enterprise payments outside the three main verticals.
This mix matters because Flywire is not tied to a single customer type. At the same time, education remains the economic anchor of the business, while travel and healthcare provide room for diversification.
The business model has also shown a meaningful shift in scale over the last several years: revenue has expanded strongly, gross profit has grown with it, and the company has moved from losses to modest profitability, even though selling and administrative costs still absorb a large share of revenue.
Key Figures
| Metric | Value | Sector ⓘ |
|---|---|---|
| Date | Sep 12, 2026 | |
| Context | ||
| Sector | Technology | |
| Industry | Software - Infrastructure | |
| Market Cap ⓘ | $2.16B | |
| Beta ⓘ | 1.31 | |
Value (Cheapness) | ||
| P/E Ratio ⓘ | 65.74 | 29.51 |
| FCF Yield ⓘ | 7.07% | 4.25% |
| EBIT / EV ⓘ | 2.54% | 2.85% |
| PEG ⓘ | N/A | |
Growth (Business expansion) | ||
| Revenue Growth ⓘ | 27.20% | 15.40% |
| RPS Growth (5Y CAGR) ⓘ | 26.75% | 8.56% |
| EPS Growth (5Y CAGR) ⓘ | N/A | -11.88% |
| Margin Growth (5Y Trend) ⓘ | N/A | 0.46% |
| FCF Growth (5Y CAGR) ⓘ | 75.38% | 9.80% |
Quality (Business durability) | ||
| ROIC (Latest) ⓘ | 5.22% | 9.44% |
| ROIC (5Y Median) ⓘ | -2.19% | 8.30% |
| Net Debt / EBIT (Latest) ⓘ | -5.84 | 0.54 |
| Net Debt / EBIT (5Y Median) ⓘ | N/A | 0.44 |
| Operating Margin (Latest) ⓘ | 6.78% | 9.58% |
| Operating Margin (5Y Median) ⓘ | -4.43% | 8.25% |
| Debt to Equity (Latest) ⓘ | 0.17% | 33.33% |
| Profit Margin (Latest) ⓘ | 4.77% | 7.14% |
| Free Cash Flow (Latest) ⓘ | $152.72M | |
Momentum (Price trend) | ||
| 3Y Return ⓘ | -43.43% | +45.48% |
| 12M Return (excl. last month) ⓘ | +48.22% | +23.48% |
| 6M Return ⓘ | +43.07% | +20.93% |
| Price vs. 200-Day MA ⓘ | +20.47% | +7.43% |
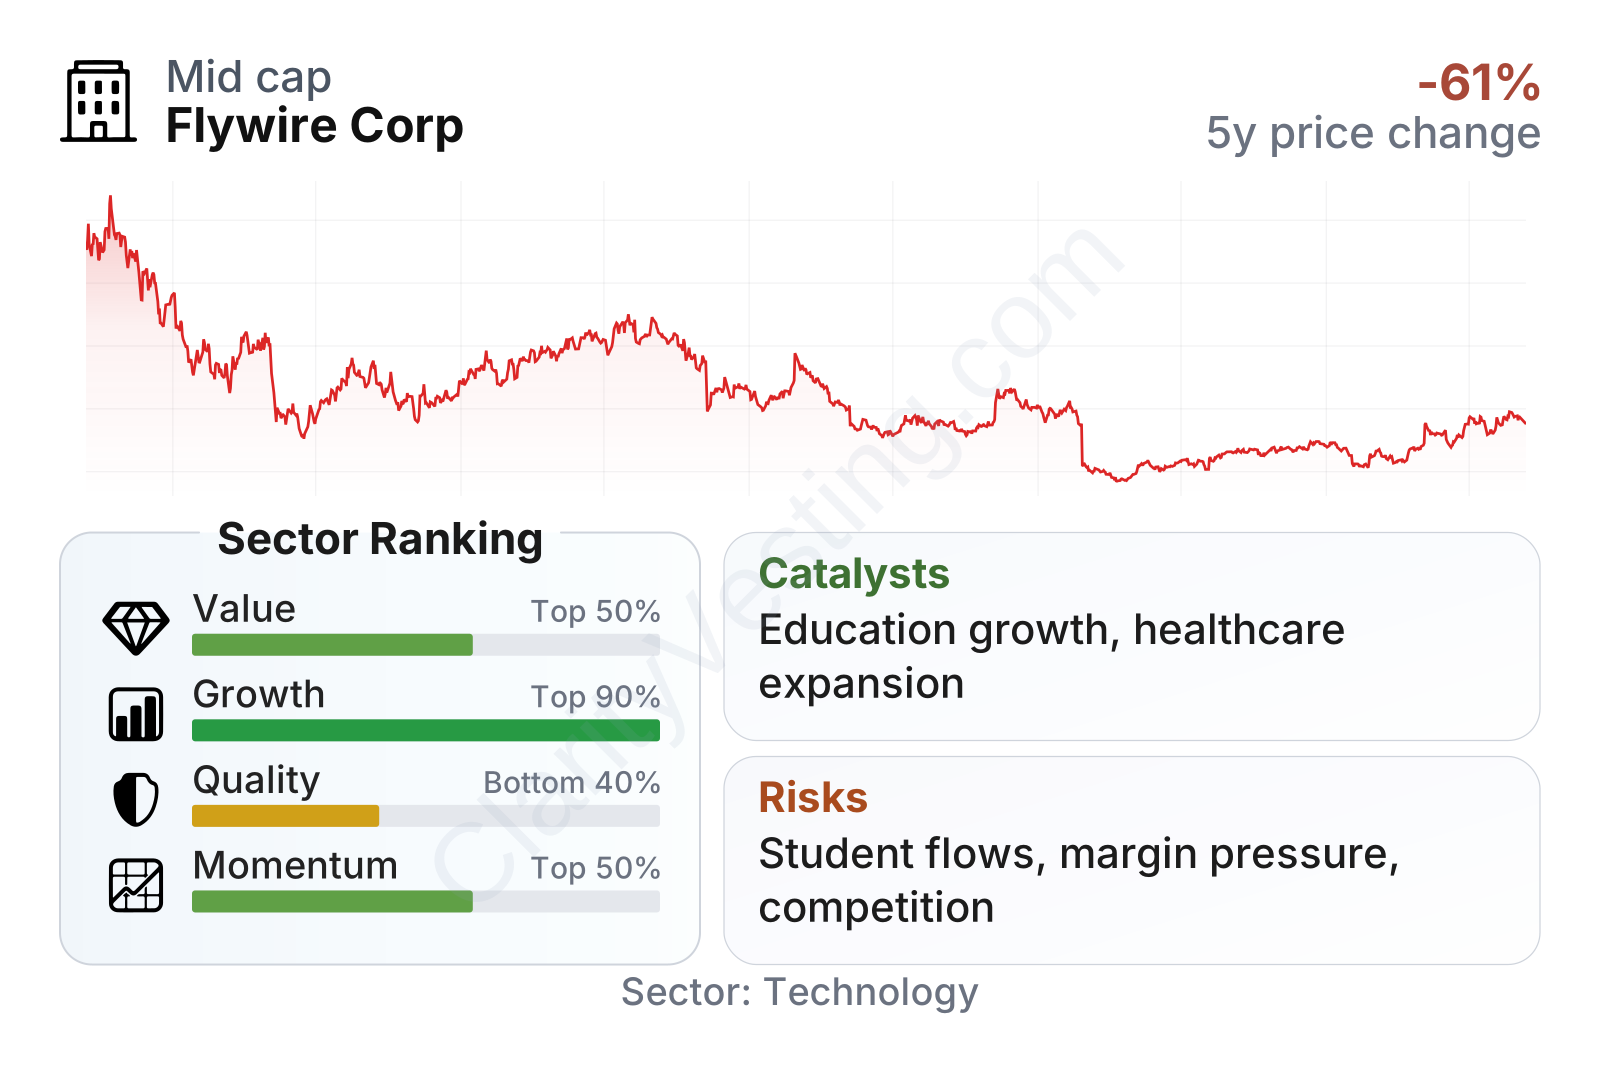
Flywire is a mid-sized software and payments company with a stock that has been volatile since its public listing. The share price remains well below early post-IPO levels over a multi-year view, even after a strong rebound in the most recent months. That pattern suggests the market has gone from very high expectations, to disappointment, and then to renewed interest as profitability and cash generation improved.
The factor table points to a business with very strong growth characteristics relative to its sector, especially in revenue expansion and free cash flow progression. Balance-sheet risk looks low, with debt levels far below the sector median and net cash still supporting the company’s flexibility. The weaker area is quality: returns on invested capital and profit margins are improving, but they still trail many software peers.
In short, the numbers describe a company that has already built scale, is growing faster than most peers, and now needs to prove that stronger growth can translate into more durable profitability.
Growth
Flywire operates in markets that have favorable long-term characteristics. Cross-border education payments are structurally complex, healthcare billing remains fragmented and inefficient, and travel merchants still need better ways to handle larger-ticket international transactions. These are not simple card-swipe markets; they involve regulation, foreign exchange, local payment methods, and reconciliation. That complexity creates demand for specialized platforms.
The company’s strategy also makes sense for future expansion because it combines software workflows with payments infrastructure. Once a client uses Flywire not just to collect money, but also to automate matching, reporting, and operational steps around a payment, the platform becomes more embedded in day-to-day operations. That can support retention and opens room for more payment volume from existing clients.
Revenue growth has remained strong for an extended period. After posting extremely high expansion in earlier years, growth moderated but stayed solid, and more recent quarters show a renewed acceleration into the upper-20% to low-40% range year over year. That is materially above the sector median and suggests Flywire is still gaining business rather than merely benefiting from a one-time reopening effect.
Cash generation is another encouraging sign. Free cash flow has improved sharply from modest or even negative levels a few years ago to well above $150 million on a trailing basis. That matters because it shows the platform is not just adding revenue; it is increasingly turning scale into cash. For a company still in expansion mode, this is an important marker of business maturity.
Recent company updates have also emphasized product expansion, client additions, and selective acquisitions to deepen vertical capabilities. In practical terms, the clearest catalysts are continued penetration in education, broader use of the platform by healthcare providers, and cross-selling software features that increase revenue per customer. If global student mobility and international travel remain healthy, those trends can support transaction volume growth.
Risks
This article is for informational purposes only and does not constitute financial advice. Some content is AI-generated. See Disclaimer


