Stock Analysis · Flex Ltd (FLEX)
Overview
Flex Ltd is a global manufacturing and supply chain company that helps other businesses design, build, and deliver products. In simple terms, many well-known technology, medical, industrial, and consumer brands outsource part of their product development and manufacturing to Flex. The company is not mainly a consumer brand itself; it is a behind-the-scenes operator that provides engineering, component sourcing, assembly, logistics, and after-market services.
Its business model is built around large-scale contract manufacturing, but Flex has been pushing beyond basic assembly into higher-value areas such as medical devices, data center power products, cloud and communications equipment, automotive electronics, and industrial solutions. That matters because these activities usually offer better margins and stickier customer relationships than pure low-cost manufacturing.
Based on the latest annual filing, Flex reports revenue through two main segments.
- Flex Agility Solutions (about 69% of revenue): focused on fast-moving and more customized markets such as communications, enterprise and cloud, lifestyle, consumer devices, industrial, and parts of healthcare. This includes design, engineering, manufacturing, and supply chain support for customers that need flexibility and speed.
- Flex Reliability Solutions (about 31% of revenue): serves markets where long product life, regulatory compliance, and reliability matter most, especially automotive, health solutions, and core industrial programs. These activities tend to be more specialized and often have higher technical requirements.
Across both segments, management has increasingly highlighted business exposure to data centers, cloud infrastructure, power systems, automotive electrification, and medical technology as important growth areas. The overall picture is a very large manufacturing platform with global reach, broad customer exposure, and an ongoing shift toward more complex and higher-value programs.
The business still runs on thin margins, which is normal in electronics manufacturing, but the operating profile has been improving. Revenue has moved back up after a softer period, and gross profit has expanded faster than sales, suggesting a better mix and stronger execution rather than simple volume growth alone.
Key Figures
| Metric | Value | Sector ⓘ |
|---|---|---|
| Date | Sep 12, 2026 | |
| Context | ||
| Sector | Technology | |
| Industry | Electronic Components | |
| Market Cap ⓘ | $39.90B | |
| Beta ⓘ | 1.65 | |
Value (Cheapness) | ||
| P/E Ratio ⓘ | 43.55 | 29.51 |
| FCF Yield ⓘ | 2.68% | 4.25% |
| EBIT / EV ⓘ | 3.26% | 2.85% |
| PEG ⓘ | 0.94 | |
Growth (Business expansion) | ||
| Revenue Growth ⓘ | 20.60% | 15.40% |
| RPS Growth (5Y CAGR) ⓘ | 9.99% | 8.56% |
| EPS Growth (5Y CAGR) ⓘ | -26.70% | -11.88% |
| Margin Growth (5Y Trend) ⓘ | 0.28% | 0.46% |
| FCF Growth (5Y CAGR) ⓘ | 16.00% | 9.80% |
Quality (Business durability) | ||
| ROIC (Latest) ⓘ | 11.69% | 9.44% |
| ROIC (5Y Median) ⓘ | 11.89% | 8.30% |
| Net Debt / EBIT (Latest) ⓘ | 2.12 | 0.54 |
| Net Debt / EBIT (5Y Median) ⓘ | 1.50 | 0.44 |
| Operating Margin (Latest) ⓘ | 4.99% | 9.58% |
| Operating Margin (5Y Median) ⓘ | 4.59% | 8.25% |
| Debt to Equity (Latest) ⓘ | 107.82% | 33.33% |
| Profit Margin (Latest) ⓘ | 3.33% | 7.14% |
| Free Cash Flow (Latest) ⓘ | $1.07B | |
Momentum (Price trend) | ||
| 3Y Return ⓘ | +514.88% | +45.48% |
| 12M Return (excl. last month) ⓘ | +140.22% | +23.48% |
| 6M Return ⓘ | +82.91% | +20.93% |
| Price vs. 200-Day MA ⓘ | +20.65% | +7.43% |
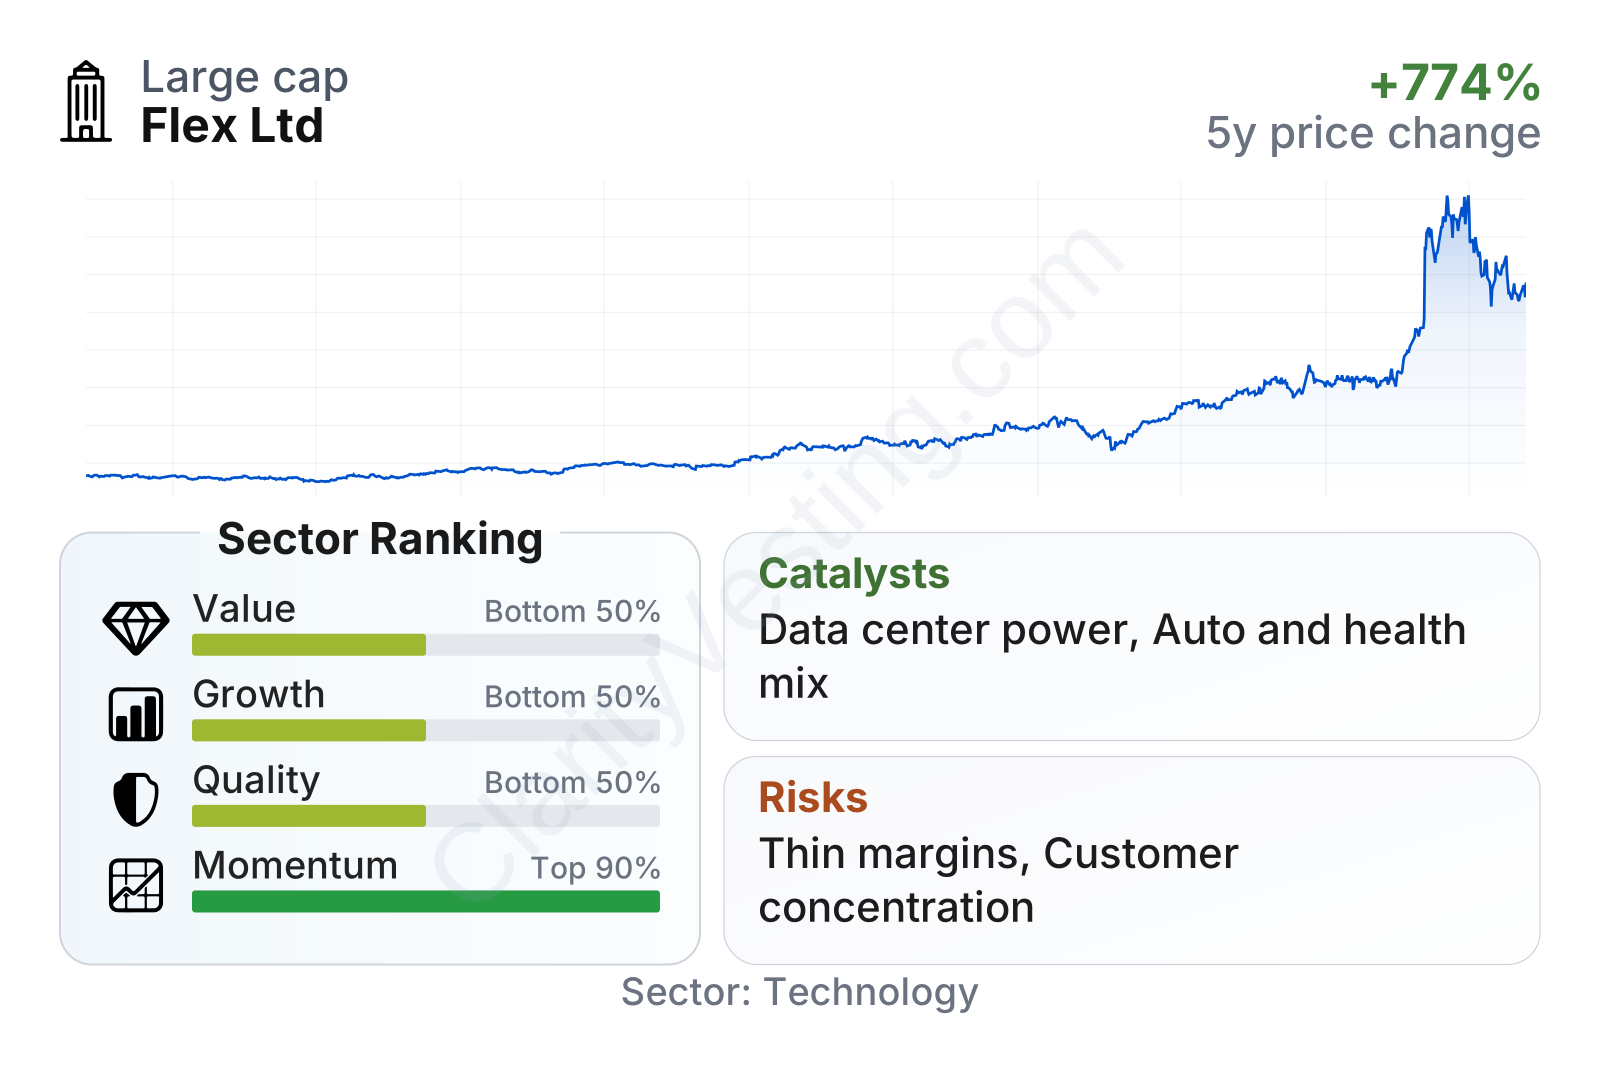
Flex is now a large-cap company with a stock that has been much more volatile than the broader market, as shown by its beta of about 1.63. In the factor breakdown, quality stands out more favorably than value or growth. Returns on invested capital are above the sector median, and the balance sheet looks healthier than many peers, especially after the sharp drop in debt-to-equity and the move to net cash relative to EBIT. On the other hand, the stock no longer looks cheap on earnings or free-cash-flow yield, and profit margins remain below typical technology-sector levels. Momentum is exceptionally strong, which explains why valuation has become a more important part of the discussion.
Growth
Flex operates in several markets that have attractive long-term demand drivers. Data center infrastructure is one of the biggest. As cloud computing, AI workloads, and power-hungry server systems expand, customers need more power shelves, power distribution units, advanced components, and highly reliable manufacturing partners. Flex has been increasing its presence in these categories. Automotive electrification is another tailwind, as electric vehicles and advanced driver systems require more electronics content per vehicle. Healthcare is also appealing because medical devices tend to have long product cycles, strict compliance requirements, and resilient demand.
The company’s strategy appears coherent for future growth because it is not trying to compete only on low-cost labor. Instead, it is moving toward programs where engineering depth, supply chain management, regulatory know-how, and manufacturing scale matter together. That combination can make customer relationships more durable and can support somewhat better profitability over time.
Recent revenue trends show that Flex has come through a weak stretch and returned to much stronger year-over-year growth, with the latest pace running above 20%. That rebound is notable because the business had previously faced declines tied to customer digestion and softer demand in some end markets. The recovery suggests that the mix is improving and that higher-priority areas such as cloud, power, and specialized industrial programs are becoming more meaningful.
Cash generation is another encouraging point. Free cash flow has climbed meaningfully over the last several years and has recently stayed above $1 billion on a trailing basis. For a manufacturing company, that matters because it shows Flex is not just reporting accounting profits; it is also converting a meaningful portion of operations into cash that can support buybacks, debt reduction, and investment in capacity for higher-growth programs.
Recent company communications have also pointed to continued momentum in data center power and related infrastructure. That is likely the clearest catalyst because it connects to one of the fastest-growing hardware spending areas in the market today and fits Flex’s existing strengths in design, production scale, and customer support.
Risks
This article is for informational purposes only and does not constitute financial advice. Some content is AI-generated. See Disclaimer


