Stock Analysis · Ford Motor Company (F)
Overview
Ford Motor Company is one of the oldest global automakers. It designs, manufactures, markets, and services a wide range of vehicles under the Ford and Lincoln brands, and it also provides financing through Ford Credit. In simple terms, Ford makes money both by selling vehicles and by helping dealers and customers finance those vehicles.
Its business is organized around a few major segments. Based on recent annual reporting, revenue is heavily concentrated in traditional automotive operations, with financing as a smaller but still meaningful contributor.
- Ford Blue and Ford Pro automotive sales: approximately 80% to 85% of total revenue combined. This includes internal combustion vehicles, hybrids, parts, accessories, service, and commercial products. Ford Pro is especially important because it covers vans, trucks, fleet services, software, and related solutions for business customers.
- Ford Model e: approximately 5% to 10% of total revenue. This segment includes electric vehicles and EV-related software and engineering activity. It remains strategically important even if it is not yet the main earnings driver.
- Ford Credit: approximately 10% to 15% of total revenue. This business provides financing and leasing to dealers and customers and can support vehicle sales while also generating earnings of its own.
- Other automotive and corporate items: a small remainder. This can include eliminations, central costs, and activities not neatly captured in the main operating segments.
Ford’s revenue mix also shows a useful business reality: the company is not just a car seller. Its strongest economic engine is increasingly tied to trucks, commercial fleets, after-sale service, financing, and software-enabled services around vehicle ownership and operation. That matters because those activities can be steadier and more profitable than relying only on one-time vehicle sales.
Over the last several years, revenue has generally moved higher, but profitability has been much less stable. Sales rose from roughly $136 billion in 2021 to about $187 billion in 2025, while operating results swung from profit to loss and back again. That pattern suggests Ford has scale and demand, but cost control and execution remain the central issues.
Key Figures
| Metric | Value | Sector ⓘ |
|---|---|---|
| Date | Sep 12, 2026 | |
| Context | ||
| Sector | Consumer Cyclical | |
| Industry | Auto Manufacturers | |
| Market Cap ⓘ | $55.71B | |
| Beta ⓘ | 1.83 | |
Value (Cheapness) | ||
| P/E Ratio ⓘ | N/A | 17.10 |
| FCF Yield ⓘ | 13.07% | 8.53% |
| EBIT / EV ⓘ | -4.42% | 6.46% |
| PEG ⓘ | 8.48 | |
Growth (Business expansion) | ||
| Revenue Growth ⓘ | -3.80% | 5.75% |
| RPS Growth (5Y CAGR) ⓘ | 8.63% | 9.14% |
| EPS Growth (5Y CAGR) ⓘ | -14.53% | -18.21% |
| Margin Growth (5Y Trend) ⓘ | -20.01% | -0.23% |
| FCF Growth (5Y CAGR) ⓘ | 6.86% | 4.91% |
Quality (Business durability) | ||
| ROIC (Latest) ⓘ | -2.35% | 12.61% |
| ROIC (5Y Median) ⓘ | 3.18% | 10.72% |
| Net Debt / EBIT (Latest) ⓘ | N/A | 2.10 |
| Net Debt / EBIT (5Y Median) ⓘ | 16.52 | 2.32 |
| Operating Margin (Latest) ⓘ | -4.40% | 9.25% |
| Operating Margin (5Y Median) ⓘ | 3.10% | 9.64% |
| Debt to Equity (Latest) ⓘ | 457.17% | 75.78% |
| Profit Margin (Latest) ⓘ | -3.94% | 5.33% |
| Free Cash Flow (Latest) ⓘ | $7.28B | |
Momentum (Price trend) | ||
| 3Y Return ⓘ | +35.51% | +14.53% |
| 12M Return (excl. last month) ⓘ | +28.66% | +3.08% |
| 6M Return ⓘ | +18.77% | +0.55% |
| Price vs. 200-Day MA ⓘ | +5.33% | -0.54% |
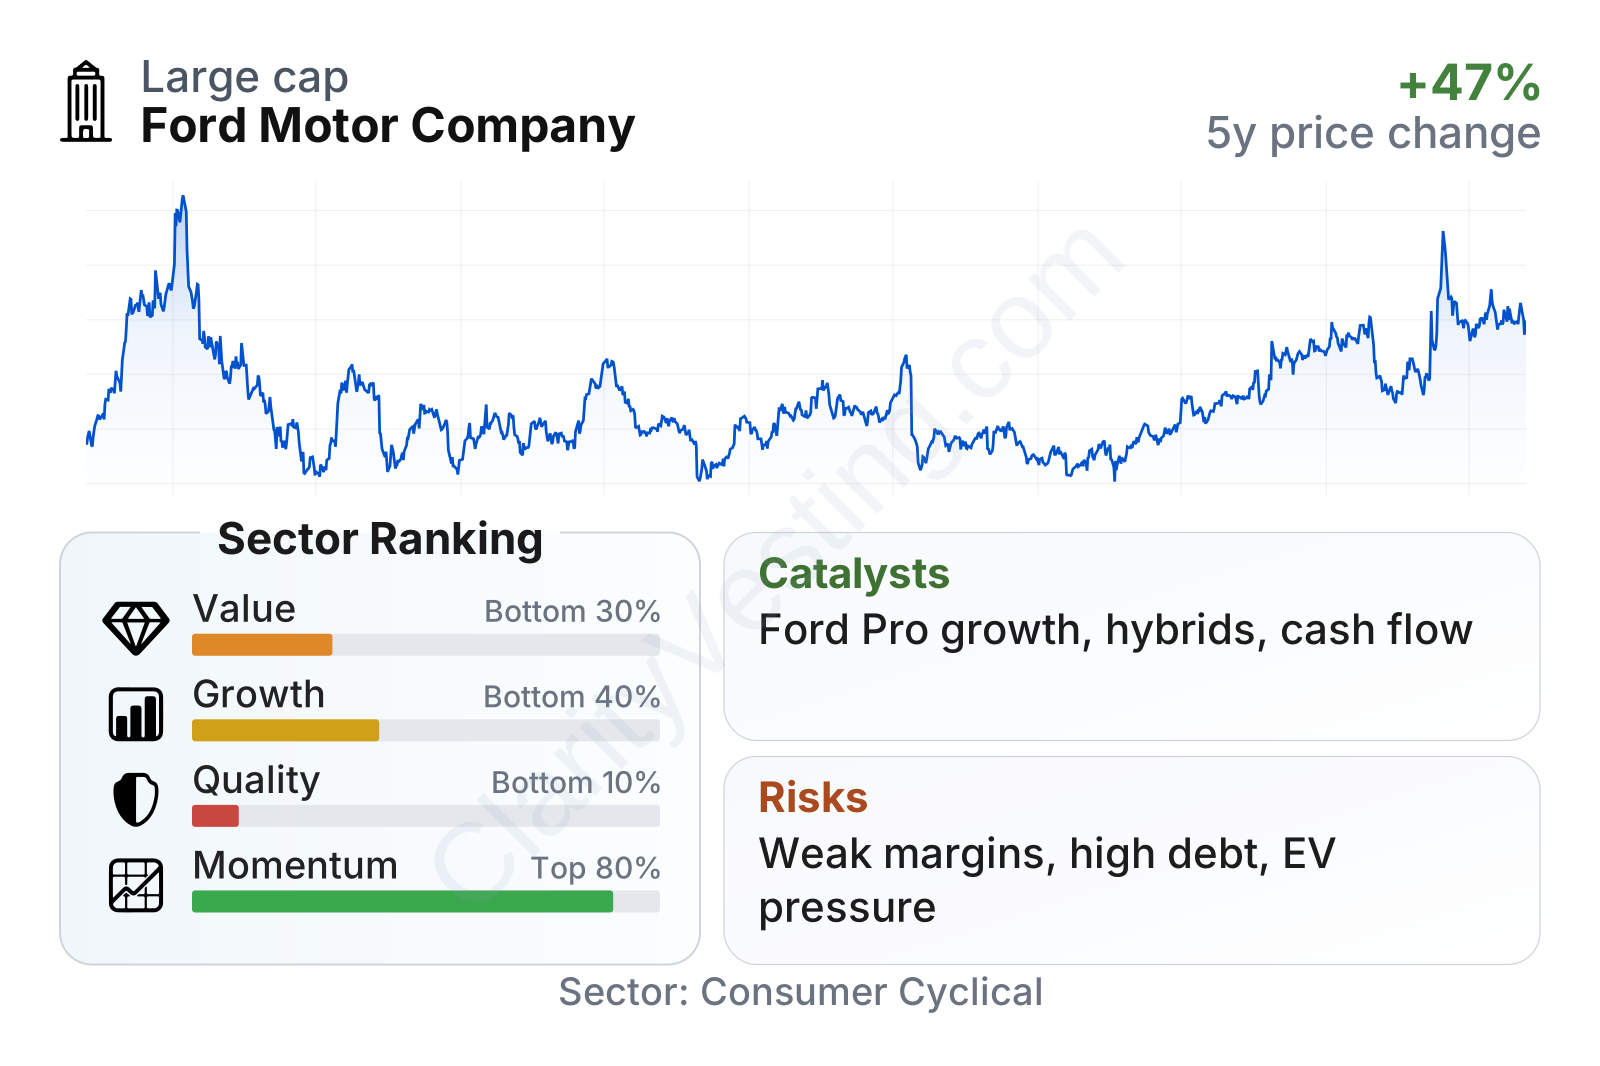
Ford is a large auto manufacturer with above-average share-price volatility, as shown by its beta near 1.8. The broader profile is mixed. On valuation-related measures, the stock looks optically inexpensive in some areas, especially through free cash flow yield, but weaker on earnings-based measures because recent profitability has deteriorated. Growth ranks below the sector median, quality is notably weak, and recent market momentum has been better than many peers.
The stock price history shows a business that the market has repeatedly re-rated rather than consistently rewarded. Shares moved sharply higher in some periods and then gave back part of those gains, reflecting how sensitive Ford is to margins, product cycles, EV expectations, and the wider economy.
Growth
Ford operates in a sector that is changing rapidly rather than expanding evenly. Global auto demand is mature in many regions, but several sub-areas still offer growth: electric vehicles, hybrids, software-enabled services, advanced driver assistance, and commercial fleet management. For Ford, the most credible long-term growth path is not simply selling more cars; it is increasing the value earned per customer through trucks, fleet customers, recurring service revenue, financing, and connected-vehicle offerings.
Ford’s strategy makes sense in that context. The company has leaned into three lanes: traditional Ford Blue vehicles that still generate most of the cash, Ford Pro for commercial customers, and Model e for EV development. That structure is practical because it separates the cash-generating legacy business from the lower-margin EV buildout. It also reflects a realistic industry view: EV adoption is important, but profits today still come mainly from trucks, vans, and services.
Revenue growth has been uneven. After a strong rebound through 2022 and 2023, recent year-over-year comparisons turned softer again, including a decline of about 4% in the latest reading versus a sector median growth rate near 6%. Over a five-year period, revenue per share growth has been positive, but not enough to place Ford among stronger growers in the industry. This is a company with scale, not a business currently delivering smooth top-line expansion.
Free cash flow is the more encouraging part of the picture. Trailing free cash flow has improved materially over the past few years and recently stood around $9 billion to $10 billion on the chart, well above levels seen in 2022 and 2023. That matters because strong cash generation gives Ford more flexibility to fund product development, support its balance sheet, and absorb the heavy investment needs of the auto industry.
A major catalyst is Ford Pro. Commercial customers tend to value reliability, service networks, uptime, and total operating cost more than branding alone. That can make fleet relationships sticky. Ford has been building this business beyond vehicle sales into software, telematics, charging support, and maintenance services, which creates the possibility of more recurring and higher-quality revenue over time.
Another catalyst is Ford’s hybrid lineup. While much market attention has focused on fully electric vehicles, hybrids have become an important middle ground for many buyers. This can benefit Ford because it already has strong truck and utility vehicle franchises where hybrid demand can add volume without requiring the company to depend entirely on a fast EV transition.
Recent company communications in 2026 have continued to emphasize capital discipline, product launches, and a measured approach to electrification. That is significant because the market has become more skeptical of EV growth at any cost. A company that can keep investing while being more selective on returns may be better positioned than one chasing volume without margin support.
Risks
This article is for informational purposes only and does not constitute financial advice. Some content is AI-generated. See Disclaimer


