Stock Analysis · Elastic NV (ESTC)
Overview
Elastic N.V. is a software company best known for the Elastic Stack and Elasticsearch, tools originally built to search and analyze large amounts of machine data quickly. Over time, the business has expanded from enterprise search into three main product areas: search, observability, and security. In simple terms, Elastic helps organizations find information across internal data, monitor applications and infrastructure, and detect cybersecurity threats. Its products can be used in self-managed environments or as a cloud service.
The company’s revenue is overwhelmingly subscription-based, which is typical for enterprise software and generally makes revenue more recurring and predictable. Based on recent annual filings, the revenue mix is approximately structured as follows:
- Subscription revenue: about 93% to 94% of total revenue. This includes paid access to Elastic’s software and cloud offerings, notably Elastic Cloud, as well as self-managed subscriptions with support and advanced features.
- Services revenue: about 6% to 7% of total revenue. This mainly includes consulting, training, and other professional services that help customers deploy and optimize the platform.
Inside subscriptions, Elastic has increasingly shifted its business toward cloud-delivered products. The company does not always disclose a precise three-way revenue split between search, observability, and security, but management has repeatedly highlighted cloud as the fastest-growing part of the business and a central driver of expansion. The customer base is broad, spanning enterprises, government agencies, and digital-native businesses that need to work with growing volumes of operational and security data.
The financial profile has also evolved. Revenue has roughly doubled over the last four fiscal years, while gross profit has remained very high, reflecting the economics of software. At the same time, operating expenses have stayed elevated because Elastic continues to invest heavily in research and development and go-to-market capabilities. More recently, that spending has become better balanced with growth, allowing operating income and cash generation to improve.
A notable trend is that revenue and gross profit have risen steadily, while the business has moved from sizable operating losses to a small operating profit. Research and development remains a major use of resources, which fits a company still expanding its platform and AI-related features.
Key Figures
| Metric | Value | Sector ⓘ |
|---|---|---|
| Date | Sep 12, 2026 | |
| Context | ||
| Sector | Technology | |
| Industry | Software - Application | |
| Market Cap ⓘ | $8.76B | |
| Beta ⓘ | 1.04 | |
Value (Cheapness) | ||
| P/E Ratio ⓘ | 23.89 | 29.51 |
| FCF Yield ⓘ | 3.99% | 4.25% |
| EBIT / EV ⓘ | 0.65% | 2.85% |
| PEG ⓘ | 4.17 | |
Growth (Business expansion) | ||
| Revenue Growth ⓘ | 15.10% | 15.40% |
| RPS Growth (5Y CAGR) ⓘ | 14.87% | 8.56% |
| EPS Growth (5Y CAGR) ⓘ | -34.86% | -11.88% |
| Margin Growth (5Y Trend) ⓘ | N/A | 0.46% |
| FCF Growth (5Y CAGR) ⓘ | N/A | 9.80% |
Quality (Business durability) | ||
| ROIC (Latest) ⓘ | -14.66% | 9.44% |
| ROIC (5Y Median) ⓘ | -6.63% | 8.30% |
| Net Debt / EBIT (Latest) ⓘ | -5.51 | 0.54 |
| Net Debt / EBIT (5Y Median) ⓘ | N/A | 0.44 |
| Operating Margin (Latest) ⓘ | 2.86% | 9.58% |
| Operating Margin (5Y Median) ⓘ | -7.62% | 8.25% |
| Debt to Equity (Latest) ⓘ | 45.94% | 33.33% |
| Profit Margin (Latest) ⓘ | 20.84% | 7.14% |
| Free Cash Flow (Latest) ⓘ | $349.04M | |
Momentum (Price trend) | ||
| 3Y Return ⓘ | +4.96% | +45.48% |
| 12M Return (excl. last month) ⓘ | +5.53% | +23.48% |
| 6M Return ⓘ | +61.30% | +20.93% |
| Price vs. 200-Day MA ⓘ | +30.48% | +7.43% |
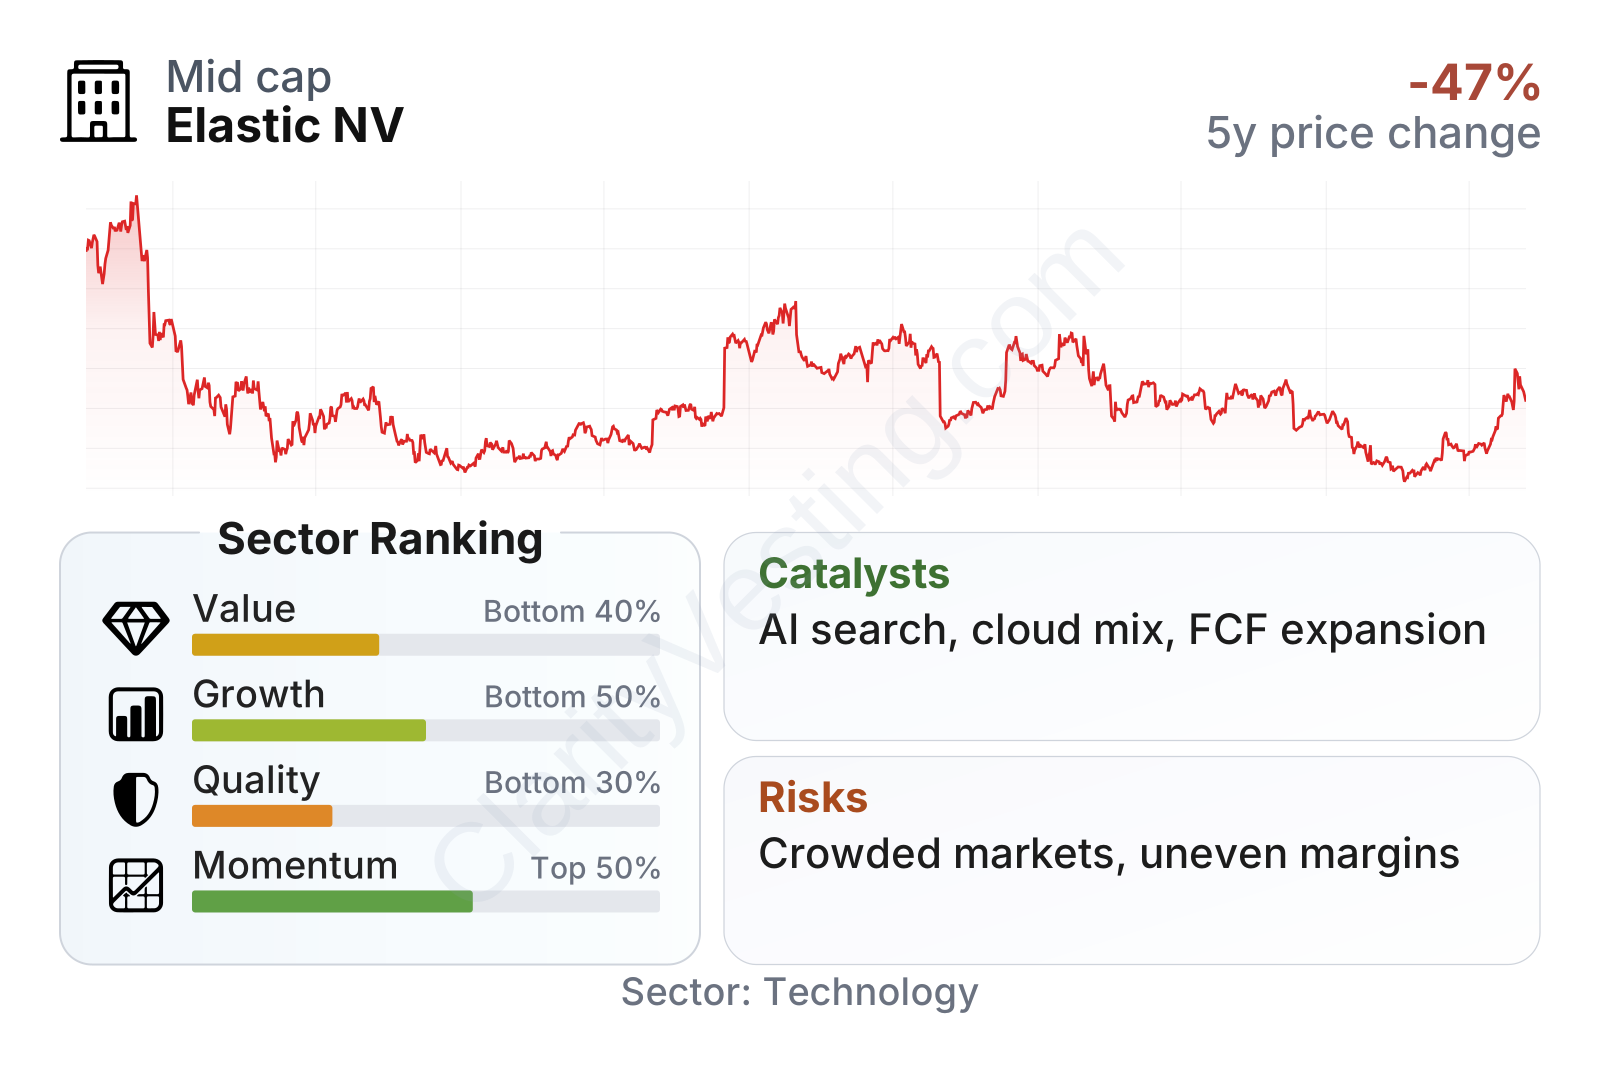
Elastic is now a mid-sized software company with a market value a little above $10 billion and a share price history that has been volatile. The stock remains far below its 2021 peak, even though the underlying business is materially larger today. In the most recent metrics, valuation looks mixed rather than obviously stretched: the earnings multiple is below the sector median, but cash flow yield and operating returns still trail many software peers. Growth is near the sector median on current revenue expansion, while long-term revenue per share growth remains clearly stronger than the median. Quality metrics are uneven: leverage is very low, but returns on invested capital and operating margins remain weaker than many companies in the sector.
Growth
Elastic operates in markets that still have long-term growth tailwinds. Search remains essential as companies try to make internal information easier to access. Observability benefits from the continued spread of cloud applications, microservices, and increasingly complex IT environments. Security is also a durable growth area because organizations need better tools to detect threats across endpoints, networks, and cloud infrastructure. These are not niche markets; they are large categories tied to digital transformation and cybersecurity spending.
The company’s strategy is coherent. Instead of selling a single narrow product, Elastic offers a platform that can serve multiple use cases on top of the same core data engine. That matters because it can lower friction for customers already using Elastic for search or observability and later expanding into security, or the reverse. This platform approach can support larger contracts and better customer retention over time. Management has also emphasized generative AI and vector search capabilities, which fit naturally with Elastic’s search heritage. As businesses look for ways to build AI applications on their own proprietary data, Elastic’s ability to index, retrieve, and rank information can become more relevant.
Growth has clearly normalized from the very high levels seen a few years ago, falling from above 40% to the mid-teens recently. That deceleration is real, but it also reflects a larger revenue base and a tougher enterprise spending environment. Even after the slowdown, Elastic is still expanding at a pace close to the software sector median, and its five-year revenue per share growth remains meaningfully above the median.
One of the most important improvements is cash generation. Free cash flow has gone from almost negligible levels a few years ago to roughly $350 million on a trailing basis. That shift suggests Elastic is no longer just a growth company consuming resources to expand, but is becoming more financially self-supporting. For a long-term view, that change is significant because it gives the company more flexibility to invest in product development, infrastructure, and potential strategic initiatives without relying heavily on external capital.
Recent company communications have also pointed to product launches and feature updates around AI, including tools for vector database use cases, retrieval, and security analytics. Those developments do not guarantee a step-change in growth, but they do place Elastic in areas where enterprise budgets are active and where its existing technology foundation is relevant.
Risks
This article is for informational purposes only and does not constitute financial advice. Some content is AI-generated. See Disclaimer


