Stock Analysis · ESCO Technologies Inc (ESE)
Overview
ESCO Technologies is a diversified industrial technology company that designs and manufactures specialized products used in aerospace, defense, utility infrastructure, life sciences, and test-and-measurement markets. In simple terms, it sells highly engineered equipment that helps customers protect electrical grids, reduce electromagnetic interference, support naval and aerospace platforms, and handle complex scientific and medical applications.
The business is organized into three main reporting segments. Based on the latest annual filing for fiscal 2025, revenue is spread across the company roughly as follows:
- Aerospace & Defense: about 42% of revenue. This segment includes filtration products for aircraft and space applications, as well as mission-critical components and systems used in naval, defense, and commercial aerospace programs.
- Utility Solutions Group: about 34% of revenue. This business mainly provides diagnostic, testing, and protection solutions for electric utilities, helping customers monitor and improve the reliability of transmission and distribution networks.
- RF Test & Measurement: about 24% of revenue. This segment focuses on electromagnetic shielding, absorbers, antennas, and testing environments used in defense, communications, automotive, and electronics applications.
That mix matters because ESCO is not dependent on one end market alone. Utilities provide exposure to grid spending, aerospace and defense add longer-cycle program revenue, and test-and-measurement brings access to technical niches where performance matters more than price.
The financial flow over the last several years shows a business that has expanded revenue and gross profit steadily, while operating income has also improved. Net income jumped sharply in fiscal 2025, but that unusually large step-up should be read carefully because part of it reflects items beyond normal operating progress rather than a simple straight-line improvement in the core business.
Key Figures
| Metric | Value | Sector ⓘ |
|---|---|---|
| Date | Sep 12, 2026 | |
| Context | ||
| Sector | Technology | |
| Industry | Scientific & Technical Instruments | |
| Market Cap ⓘ | $6.92B | |
| Beta ⓘ | 1.09 | |
Value (Cheapness) | ||
| P/E Ratio ⓘ | 50.24 | 29.51 |
| FCF Yield ⓘ | 2.84% | 4.25% |
| EBIT / EV ⓘ | 2.42% | 2.85% |
| PEG ⓘ | 1.67 | |
Growth (Business expansion) | ||
| Revenue Growth ⓘ | 14.40% | 15.40% |
| RPS Growth (5Y CAGR) ⓘ | 11.57% | 8.56% |
| EPS Growth (5Y CAGR) ⓘ | 16.83% | -11.88% |
| Margin Growth (5Y Trend) ⓘ | 3.96% | 0.46% |
| FCF Growth (5Y CAGR) ⓘ | 21.30% | 9.80% |
Quality (Business durability) | ||
| ROIC (Latest) ⓘ | 8.31% | 9.44% |
| ROIC (5Y Median) ⓘ | 15.68% | 8.30% |
| Net Debt / EBIT (Latest) ⓘ | 0.63 | 0.54 |
| Net Debt / EBIT (5Y Median) ⓘ | 0.76 | 0.44 |
| Operating Margin (Latest) ⓘ | 15.25% | 9.58% |
| Operating Margin (5Y Median) ⓘ | 13.92% | 8.25% |
| Debt to Equity (Latest) ⓘ | 7.98% | 33.33% |
| Profit Margin (Latest) ⓘ | 24.39% | 7.14% |
| Free Cash Flow (Latest) ⓘ | $196.60M | |
Momentum (Price trend) | ||
| 3Y Return ⓘ | +166.03% | +45.48% |
| 12M Return (excl. last month) ⓘ | +50.77% | +23.48% |
| 6M Return ⓘ | +1.50% | +20.93% |
| Price vs. 200-Day MA ⓘ | -2.81% | +7.43% |
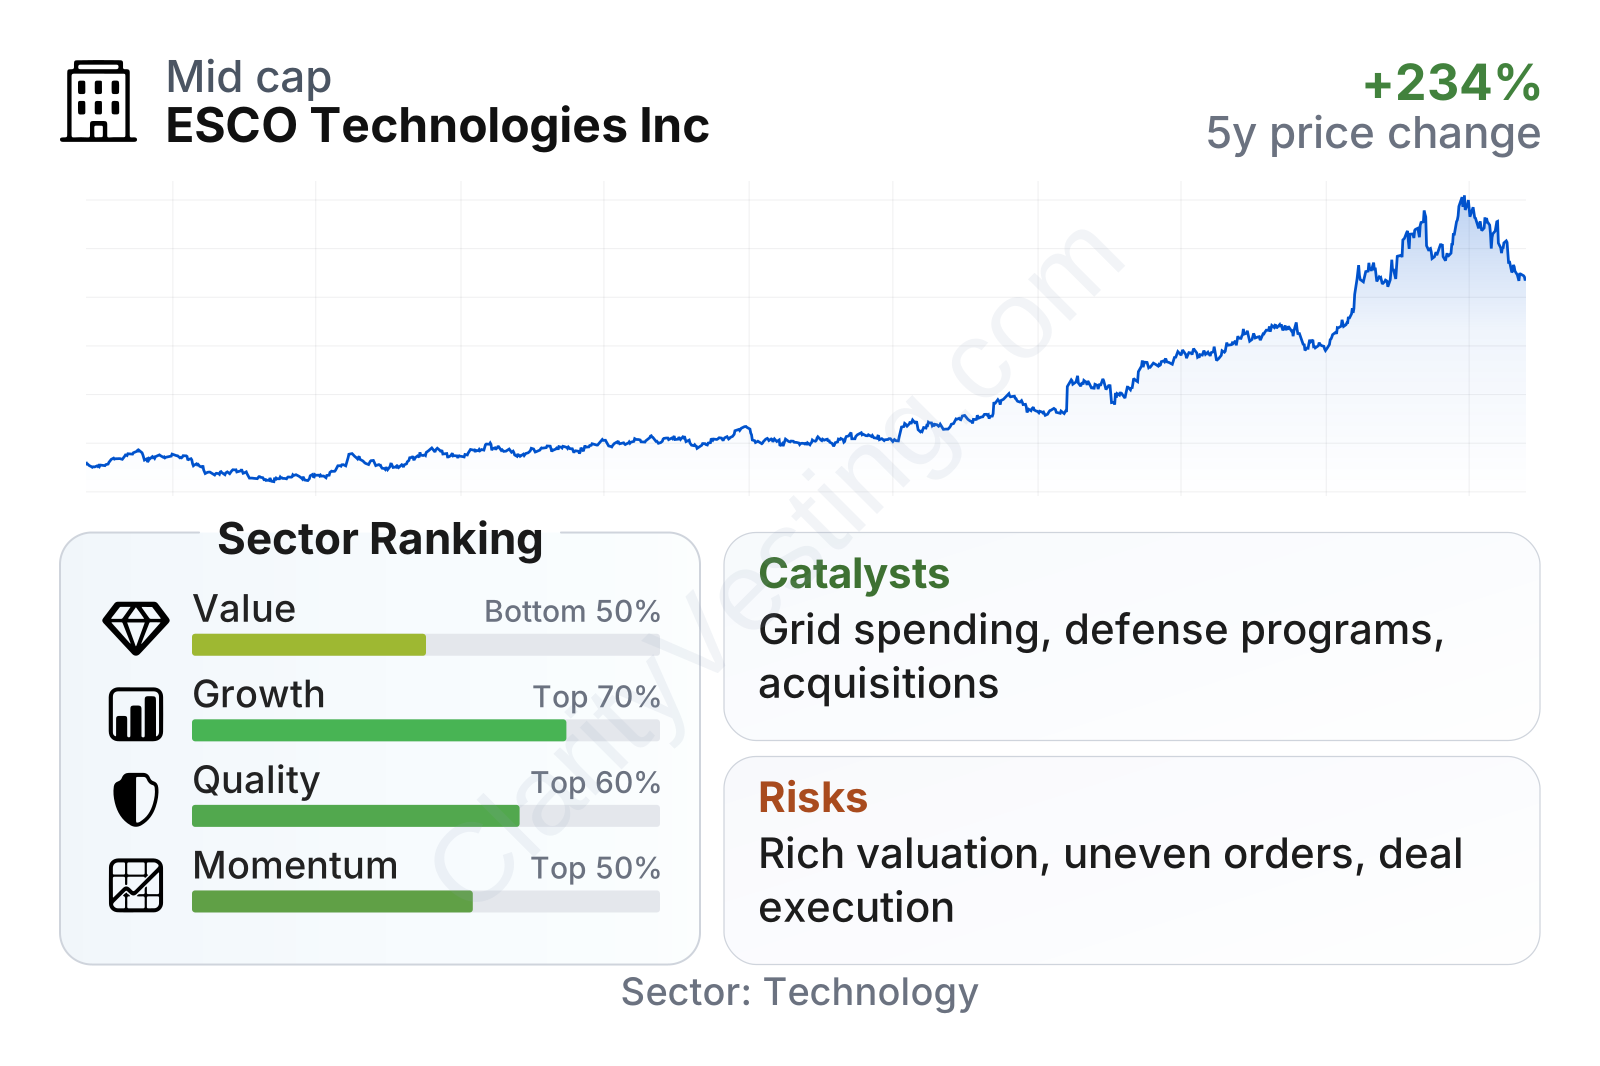
ESCO sits in the mid-cap range, with share-price volatility close to the broader market rather than extremely defensive levels. The broad picture from the latest metrics is mixed but understandable: growth and profitability look strong relative to much of the sector, balance-sheet leverage is low, and recent price performance has been powerful. The weaker point is valuation, with the stock screening as expensive on several common measures even though operating quality has improved.
Growth
ESCO operates in markets with durable long-term demand drivers. Utility infrastructure is benefiting from grid modernization, resilience spending, and higher monitoring needs as power networks become more complex. Aerospace and defense demand is supported by aircraft build rates, aftermarket requirements, naval programs, and broader defense electronics needs. RF shielding and test environments also have favorable exposure to defense systems, space, communications, and advanced electronics.
The company’s strategy also looks coherent for long-term expansion. ESCO tends to focus on niche areas where products are technically demanding, reliability is critical, and customer qualification cycles are long. That usually leads to stickier customer relationships and less direct price competition than in more commoditized industrial markets. The company has also used acquisitions to deepen existing platforms rather than chasing unrelated categories, which generally makes integration more manageable.
Revenue growth has not been perfectly smooth from quarter to quarter, which is normal for a company exposed to project timing, program schedules, and acquisitions. Still, the broader trend has been favorable. The latest year-over-year growth rate remains in the mid-teens, and the five-year revenue-per-share growth rate is ahead of the sector median. Earnings growth over five years is especially notable, helped by both sales expansion and better margins.
Cash generation is another encouraging point. Free cash flow has risen sharply over the last few years, reaching a level that is several times higher than it was earlier in the period shown. That kind of improvement gives ESCO more flexibility to fund acquisitions, invest in product development, and maintain a conservative balance sheet.
A meaningful recent catalyst has been continued strength in utility-grid spending and demand tied to defense and aerospace programs. ESCO has also highlighted acquisitions and program wins in recent company communications that expand its addressable market and product offering, especially in utility and aerospace-related niches. Those developments support the idea that growth is coming from both market demand and company-specific execution, not only from a favorable industry cycle.
Risks
This article is for informational purposes only and does not constitute financial advice. Some content is AI-generated. See Disclaimer


