Stock Analysis · Everforth Inc (EFOR)
Overview
Everforth Inc is a technology services company that provides information technology and digital solutions to business and government customers. In practical terms, it helps organizations run core operations, modernize systems, manage infrastructure, and outsource selected business processes. The business appears to be built around large contracts, recurring service relationships, and operational delivery rather than consumer products.
The company’s revenue mix is not fully broken out in the material available here at a detailed segment percentage level for 2026, so it is more reliable to describe the main sources of revenue by business type rather than assign unsupported figures.
- IT services and managed services — ongoing technology operations, infrastructure support, and enterprise service delivery for customers.
- Digital transformation and consulting work — modernization projects, application-related work, and technology implementation services.
- Business process and outsourced operations support — service contracts where clients rely on Everforth to handle repeatable operational functions.
- Government and regulated-sector contracts — if a meaningful portion of customers are public-sector or highly regulated organizations, these contracts can add stability but often bring longer sales cycles and compliance demands.
Financially, Everforth is a mid-sized company within the broad technology sector. Revenue peaked above $4.5 billion in 2022 and then declined to just under $4.0 billion in 2025. Over the same period, gross profit and operating income also moved lower, showing that the current phase is less about expansion and more about protecting profitability and cash generation while the business adjusts.
The long-term pattern shows a business that still converts a meaningful share of revenue into gross profit and operating cash, but with less earnings left over after operating costs and interest expense than a few years ago. That matters because it suggests the company still has an economically useful base business, yet one operating under pressure.
Key Figures
| Metric | Value | Sector ⓘ |
|---|---|---|
| Date | Aug 22, 2026 | |
| Context | ||
| Sector | Technology | |
| Industry | Information Technology Services | |
| Market Cap ⓘ | $1.32B | |
| Beta ⓘ | 0.44 | |
Value (Cheapness) | ||
| P/E Ratio ⓘ | 16.50 | 30.63 |
| FCF Yield ⓘ | 16.76% | 4.23% |
| EBIT / EV ⓘ | 7.41% | 2.79% |
| PEG ⓘ | 0.64 | |
Growth (Business expansion) | ||
| Revenue Growth ⓘ | -1.30% | 15.90% |
| RPS Growth (5Y CAGR) ⓘ | 5.06% | 8.68% |
| EPS Growth (5Y CAGR) ⓘ | -33.27% | -12.38% |
| Margin Growth (5Y Trend) ⓘ | -2.97% | 0.39% |
| FCF Growth (5Y CAGR) ⓘ | 16.02% | 9.76% |
Quality (Business durability) | ||
| ROIC (Latest) ⓘ | 4.16% | 9.19% |
| ROIC (5Y Median) ⓘ | N/A | 8.21% |
| Net Debt / EBIT (Latest) ⓘ | 7.18 | 0.46 |
| Net Debt / EBIT (5Y Median) ⓘ | 2.57 | 0.42 |
| Operating Margin (Latest) ⓘ | 4.86% | 9.23% |
| Operating Margin (5Y Median) ⓘ | 8.18% | 8.19% |
| Debt to Equity (Latest) ⓘ | 79.67% | 32.74% |
| Profit Margin (Latest) ⓘ | 2.09% | 7.01% |
| Free Cash Flow (Latest) ⓘ | $221.10M | |
Momentum (Price trend) | ||
| 3Y Return ⓘ | -58.75% | +46.51% |
| 12M Return (excl. last month) ⓘ | -59.02% | +18.95% |
| 6M Return ⓘ | -26.50% | +18.99% |
| Price vs. 200-Day MA ⓘ | -6.28% | +9.57% |
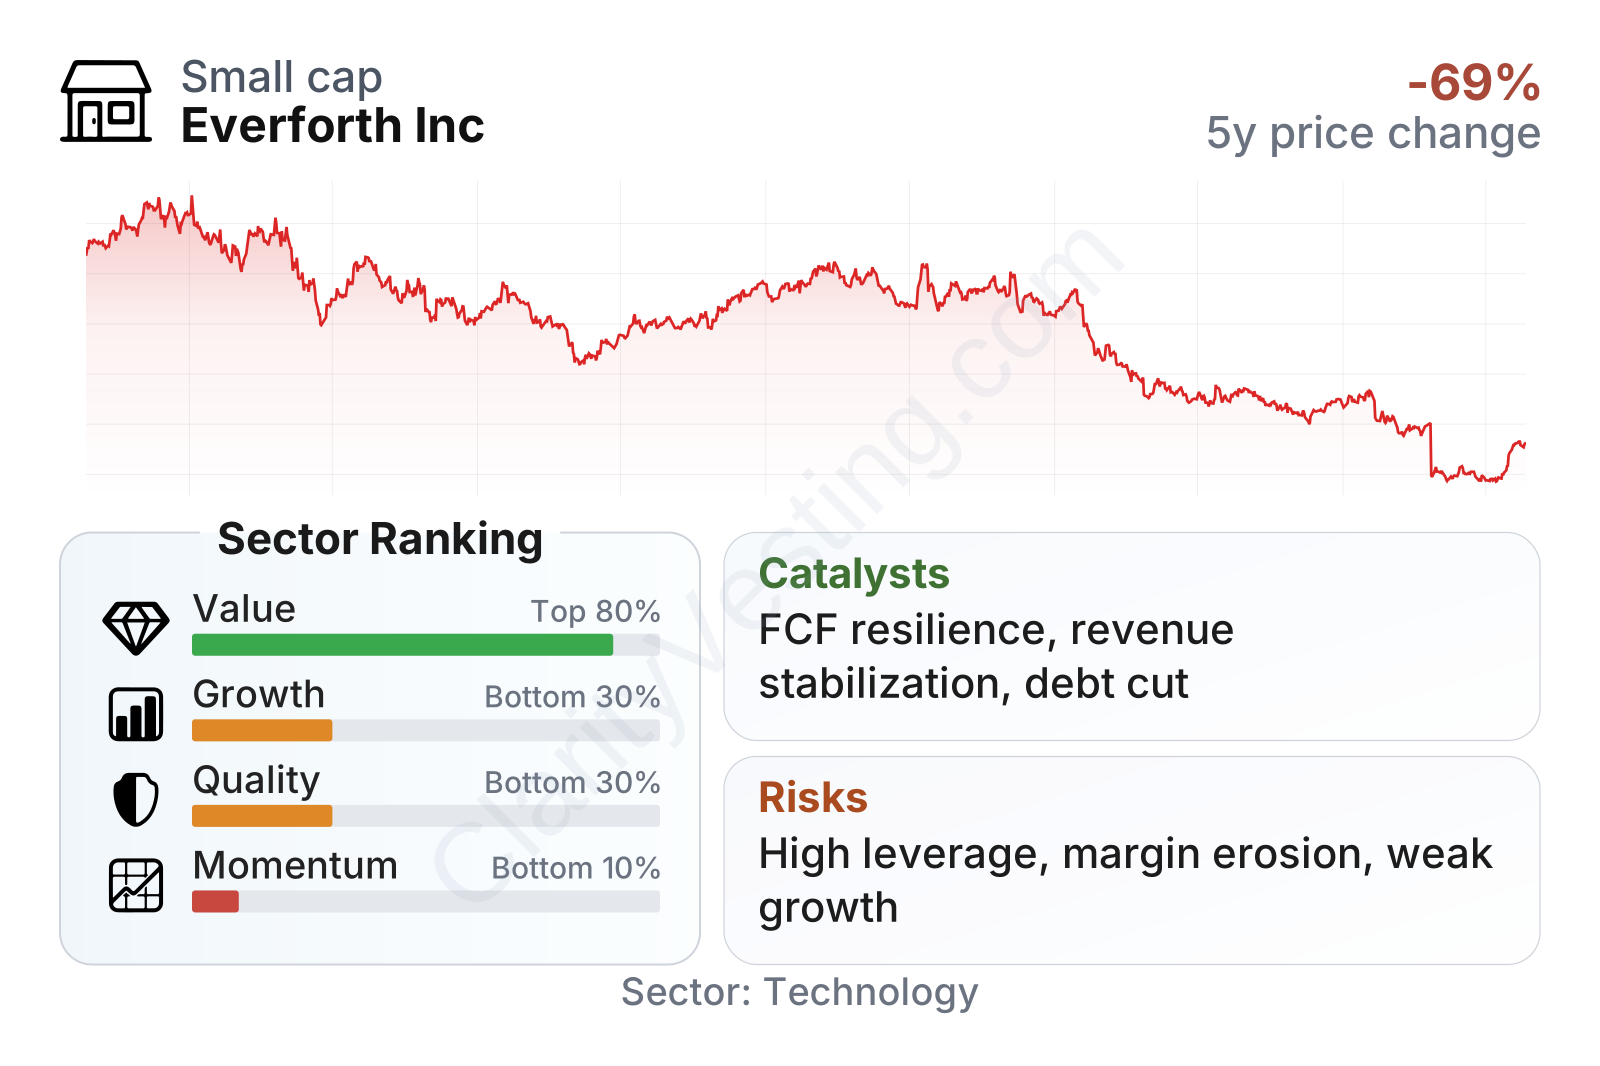
The overall picture is mixed. On valuation measures, Everforth screens cheaper than much of the technology sector: its earnings multiple is well below the sector median, and its free cash flow yield is unusually high. That said, weaker growth, below-median profitability, and very poor share-price momentum explain why the market is assigning a lower multiple. The company’s lower beta also suggests the stock has not been moving as aggressively as many technology names, but the longer-term price trend has still been sharply negative.
Growth
Everforth operates in a sector with durable long-term demand. Companies and public institutions continue to spend on cloud migration, cybersecurity, automation, AI-enabled workflows, and outsourcing of technology operations. That broader backdrop is supportive because customers still need to modernize systems and control costs, even when budgets are tight.
The challenge is that Everforth’s recent results have not matched that sector tailwind. Revenue growth slowed from double-digit gains in 2022 to declines across much of 2023, 2024, and 2025, and the latest reading remains slightly negative year over year. That places the company behind the median technology peer on recent expansion.
The more constructive angle is cash generation. Even with softer sales, Everforth has continued to produce substantial trailing free cash flow, and its five-year free cash flow growth rate is stronger than the sector median. In plain language, the company has been better at turning its business into cash than its revenue trend alone would suggest. That can create room for debt reduction, restructuring, or selective reinvestment if management executes well.
A realistic growth case depends less on a broad industry boom and more on company-specific improvement: stabilizing revenue, winning new contracts, improving client retention, and shifting work toward higher-value services. If management can move the business mix toward more recurring, higher-margin offerings while holding costs in check, even modest top-line improvement could have an outsized effect on earnings because margins have already compressed.
As for near-term catalysts, the most important ones are operational rather than speculative: evidence that revenue declines have bottomed, sustained free cash flow despite lower sales, and any signs that debt is beginning to move down. Those would be more meaningful than headline excitement because they would show the underlying business is regaining balance.
Risks
This article is for informational purposes only and does not constitute financial advice. Some content is AI-generated. See Disclaimer