Stock Analysis · Dynatrace Holdings LLC (DT)
Overview
Dynatrace is a software company focused on observability, application performance monitoring, infrastructure monitoring, log analytics, automation, and application security. In simple terms, its platform helps businesses keep their digital systems running well by showing what is happening across cloud infrastructure, applications, networks, and user experiences. This matters because modern companies depend on complex software environments that are difficult to manage manually.
The company sells its platform mainly as subscription software. Its products are used by enterprises that run large and often hybrid technology environments, including public cloud, private cloud, and on-premises systems. A central part of the product offering is the use of automation and AI-driven analysis to detect performance issues, understand root causes, and prioritize actions faster.
Based on the latest annual filing, Dynatrace generates the vast majority of its revenue from subscriptions, with a much smaller contribution from services.
- Subscription revenue: about 94% of total revenue. This includes access to the Dynatrace platform and its various monitoring, observability, analytics, and security capabilities delivered under recurring contracts.
- Services revenue: about 6% of total revenue. This mainly includes professional services such as implementation, training, and other customer support-related work.
That revenue mix is important for long-term analysis because recurring subscription revenue generally creates better visibility than one-time software sales. The business model also benefits from customer expansion over time as existing users add more workloads, modules, and use cases.
The company’s financial structure also shows a software profile with high gross profit and meaningful spending on research and development. Revenue has climbed from below $1.0 billion in fiscal 2022 to just above $2.0 billion in fiscal 2026, while gross profit has remained very high, showing the attractive economics of a scaled software platform.
Over the last five fiscal years, the business has expanded steadily while keeping a large share of revenue as gross profit. Research and development has risen materially, which suggests management is still investing for product depth, while operating income has also improved, indicating that scale is starting to offset part of that spending.
Key Figures
| Metric | Value | Sector ⓘ |
|---|---|---|
| Date | Sep 12, 2026 | |
| Context | ||
| Sector | Technology | |
| Industry | Software - Application | |
| Market Cap ⓘ | $14.82B | |
| Beta ⓘ | 0.74 | |
Value (Cheapness) | ||
| P/E Ratio ⓘ | 102.14 | 29.51 |
| FCF Yield ⓘ | 3.83% | 4.25% |
| EBIT / EV ⓘ | 2.02% | 2.85% |
| PEG ⓘ | 1.05 | |
Growth (Business expansion) | ||
| Revenue Growth ⓘ | 16.20% | 15.40% |
| RPS Growth (5Y CAGR) ⓘ | 20.57% | 8.56% |
| EPS Growth (5Y CAGR) ⓘ | -31.56% | -11.88% |
| Margin Growth (5Y Trend) ⓘ | 6.05% | 0.46% |
| FCF Growth (5Y CAGR) ⓘ | 22.62% | 9.80% |
Quality (Business durability) | ||
| ROIC (Latest) ⓘ | 5.40% | 9.44% |
| ROIC (5Y Median) ⓘ | 7.04% | 8.30% |
| Net Debt / EBIT (Latest) ⓘ | -3.20 | 0.54 |
| Net Debt / EBIT (5Y Median) ⓘ | -4.21 | 0.44 |
| Operating Margin (Latest) ⓘ | 13.39% | 9.58% |
| Operating Margin (5Y Median) ⓘ | 10.83% | 8.25% |
| Debt to Equity (Latest) ⓘ | 6.50% | 33.33% |
| Profit Margin (Latest) ⓘ | 7.22% | 7.14% |
| Free Cash Flow (Latest) ⓘ | $568.12M | |
Momentum (Price trend) | ||
| 3Y Return ⓘ | +7.52% | +45.48% |
| 12M Return (excl. last month) ⓘ | +6.03% | +23.48% |
| 6M Return ⓘ | +34.32% | +20.93% |
| Price vs. 200-Day MA ⓘ | +22.64% | +7.43% |
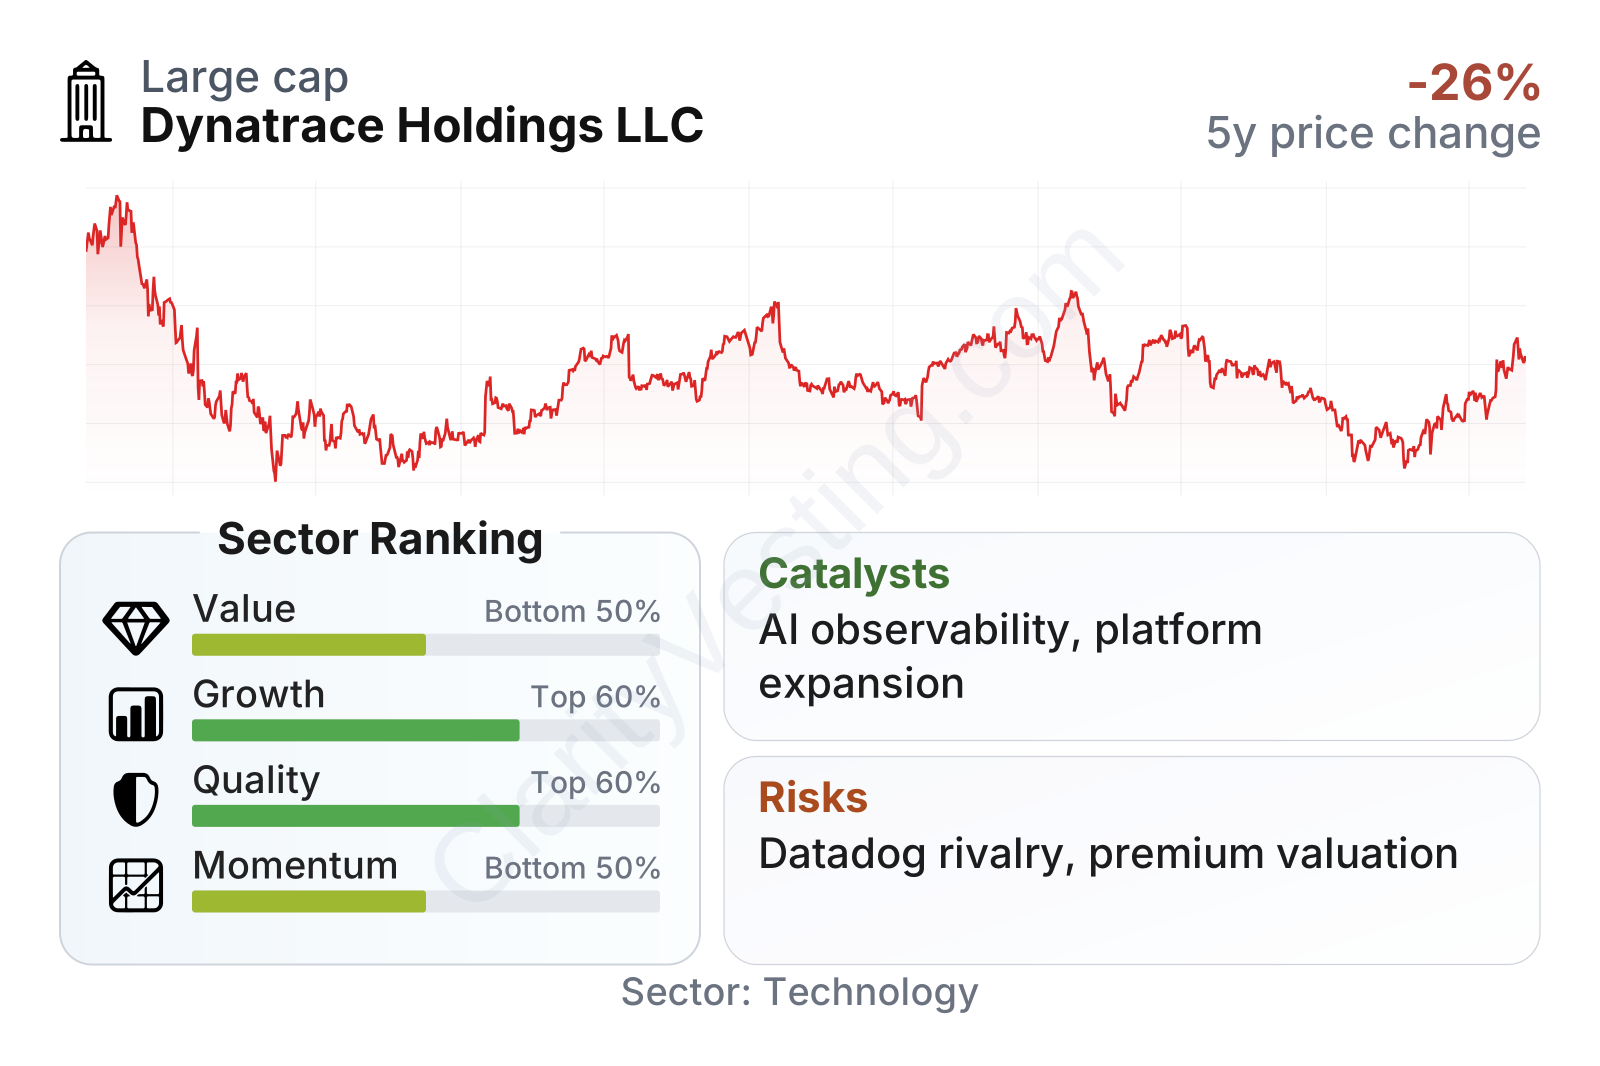
Dynatrace is a mid-sized software company with a market value in the tens of billions of dollars and a relatively low beta of about 0.71, meaning the stock has historically moved less than the broader market. The factor mix is mixed but understandable: valuation ranks in the lower half of the sector because the earnings multiple is high, while growth and quality rank somewhat better thanks to recurring revenue, improving margins, strong cash generation, and very low leverage. Momentum is less consistent over longer periods, even though the shorter-term trend has improved.
The main takeaway from the current metric profile is that Dynatrace looks financially solid, but not obviously cheap. Its balance sheet strength stands out more clearly than its valuation.
Growth
Dynatrace operates in a growing part of enterprise software. Businesses are still moving workloads to the cloud, managing more complex hybrid environments, and depending on software for core operations. That creates ongoing demand for observability, automation, security monitoring, and AI-assisted operations tools. These are not temporary needs. As digital systems become more interconnected, it becomes harder for internal teams to detect and fix issues without specialized software.
The company’s strategy appears aligned with that long-term direction. Dynatrace has built a platform approach rather than a narrow point solution, which can help it expand within existing customers. Instead of selling only one monitoring tool, it can add infrastructure monitoring, log management, application security, digital experience monitoring, and automation features over time. That kind of expansion model can support durable growth if product quality remains strong.
Another positive point is that Dynatrace is increasingly tied to AI adoption in enterprise IT. As companies add more AI workloads and larger data flows, system complexity rises further. Observability and automation tools can become more relevant in that environment because they help manage performance, reliability, and cost across distributed systems.
Revenue growth has moderated from the very high rates seen earlier in the company’s public history, but it has remained healthy. Recent year-over-year growth has been around the mid-teens to high-teens range, which is close to or slightly above the sector median. That suggests Dynatrace is still expanding at a solid pace even after reaching much larger scale.
Cash generation adds credibility to the growth profile. Free cash flow has increased strongly over the last several years, rising from a little above $200 million to more than $500 million on a trailing basis. That matters because it shows revenue growth is not coming only from heavy spending with little payoff; the business is producing real cash while it scales.
A notable recent catalyst is the company’s continued push around AI-powered observability and platform expansion, supported by new product capabilities and partnerships highlighted in company communications. Enterprise customers are looking for fewer tools, more automation, and clearer visibility across increasingly complex environments. Dynatrace’s unified platform is positioned to benefit if that consolidation trend continues.
Risks
This article is for informational purposes only and does not constitute financial advice. Some content is AI-generated. See Disclaimer


