Stock Analysis · Driven Brands Holdings Inc (DRVN)
Overview
Driven Brands Holdings Inc. is a large automotive services company focused on everyday vehicle needs rather than new car sales. Its business is built around maintenance, car wash, paint and collision repair, and glass services, mostly through franchised and company-operated locations. The company owns a portfolio of well-known brands including Take 5 Oil Change, Maaco, Meineke, CARSTAR, ABRA, Fix Auto USA, Take 5 Car Wash, and Auto Glass Now. This makes Driven Brands more of an auto services platform than a traditional dealership operator.
Its revenue comes from a mix of company-operated store sales, franchise royalties and fees, product sales to franchisees, and services tied to repair networks. Based on recent company reporting, the largest operating segments are generally led by maintenance and car wash, followed by paint, collision and glass, then the franchising-focused platform. A simple way to think about the business is:
- Maintenance: roughly 35% to 40% of revenue. This mainly includes Take 5 Oil Change and other maintenance services such as oil changes and routine vehicle care.
- Car Wash: roughly 25% to 30% of revenue. This includes Take 5 Car Wash locations and related membership or wash sales.
- Paint, Collision & Glass: roughly 20% to 25% of revenue. This covers collision repair, paint, and auto glass services through brands like Maaco, CARSTAR, ABRA, Fix Auto USA, and Auto Glass Now.
- Platform Services: roughly 10% to 15% of revenue. This includes franchise royalties, fees, support services, and supply-chain-related activity across the brand portfolio.
The attraction of this model is that car maintenance and repair are recurring needs. People can postpone buying a new car, but they still need oil changes, repairs, and windshield replacement. That tends to make demand more resilient than many other consumer businesses.
Over the last several years, the company expanded revenue meaningfully, but profitability was far less stable. Revenue rose from about $1.5 billion in 2021 to more than $2.3 billion in 2024 before dropping back to about $1.9 billion in 2025. The income picture was much more volatile, with losses in 2023 and 2024 before a return to positive net income in 2025. That gap between sales growth and earnings stability is one of the central points in evaluating the company.
The financial flow shows a business with solid gross profit generation, but one that has been heavily affected by operating costs and interest expense. The return to positive operating income and net income in 2025 suggests that the business has regained some discipline, although the path has not been smooth.
Key Figures
| Metric | Value | Sector ⓘ |
|---|---|---|
| Date | Sep 12, 2026 | |
| Context | ||
| Sector | Consumer Cyclical | |
| Industry | Auto & Truck Dealerships | |
| Market Cap ⓘ | $2.03B | |
| Beta ⓘ | 0.95 | |
Value (Cheapness) | ||
| P/E Ratio ⓘ | 12.68 | 17.10 |
| FCF Yield ⓘ | 6.50% | 8.53% |
| EBIT / EV ⓘ | N/A | 6.46% |
| PEG ⓘ | 0.93 | |
Growth (Business expansion) | ||
| Revenue Growth ⓘ | 6.80% | 5.75% |
| RPS Growth (5Y CAGR) ⓘ | 6.27% | 9.14% |
| EPS Growth (5Y CAGR) ⓘ | -19.18% | -18.21% |
| Margin Growth (5Y Trend) ⓘ | 5.36% | -0.23% |
| FCF Growth (5Y CAGR) ⓘ | -3.26% | 4.91% |
Quality (Business durability) | ||
| ROIC (Latest) ⓘ | N/A | 12.61% |
| ROIC (5Y Median) ⓘ | 2.26% | 10.72% |
| Net Debt / EBIT (Latest) ⓘ | N/A | 2.10 |
| Net Debt / EBIT (5Y Median) ⓘ | 21.02 | 2.32 |
| Operating Margin (Latest) ⓘ | N/A | 9.25% |
| Operating Margin (5Y Median) ⓘ | 8.97% | 9.64% |
| Debt to Equity (Latest) ⓘ | 266.47% | 75.78% |
| Profit Margin (Latest) ⓘ | 8.56% | 5.33% |
| Free Cash Flow (Latest) ⓘ | $131.84M | |
Momentum (Price trend) | ||
| 3Y Return ⓘ | -9.67% | +14.53% |
| 12M Return (excl. last month) ⓘ | -25.89% | +3.08% |
| 6M Return ⓘ | +15.94% | +0.55% |
| Price vs. 200-Day MA ⓘ | -12.11% | -0.54% |
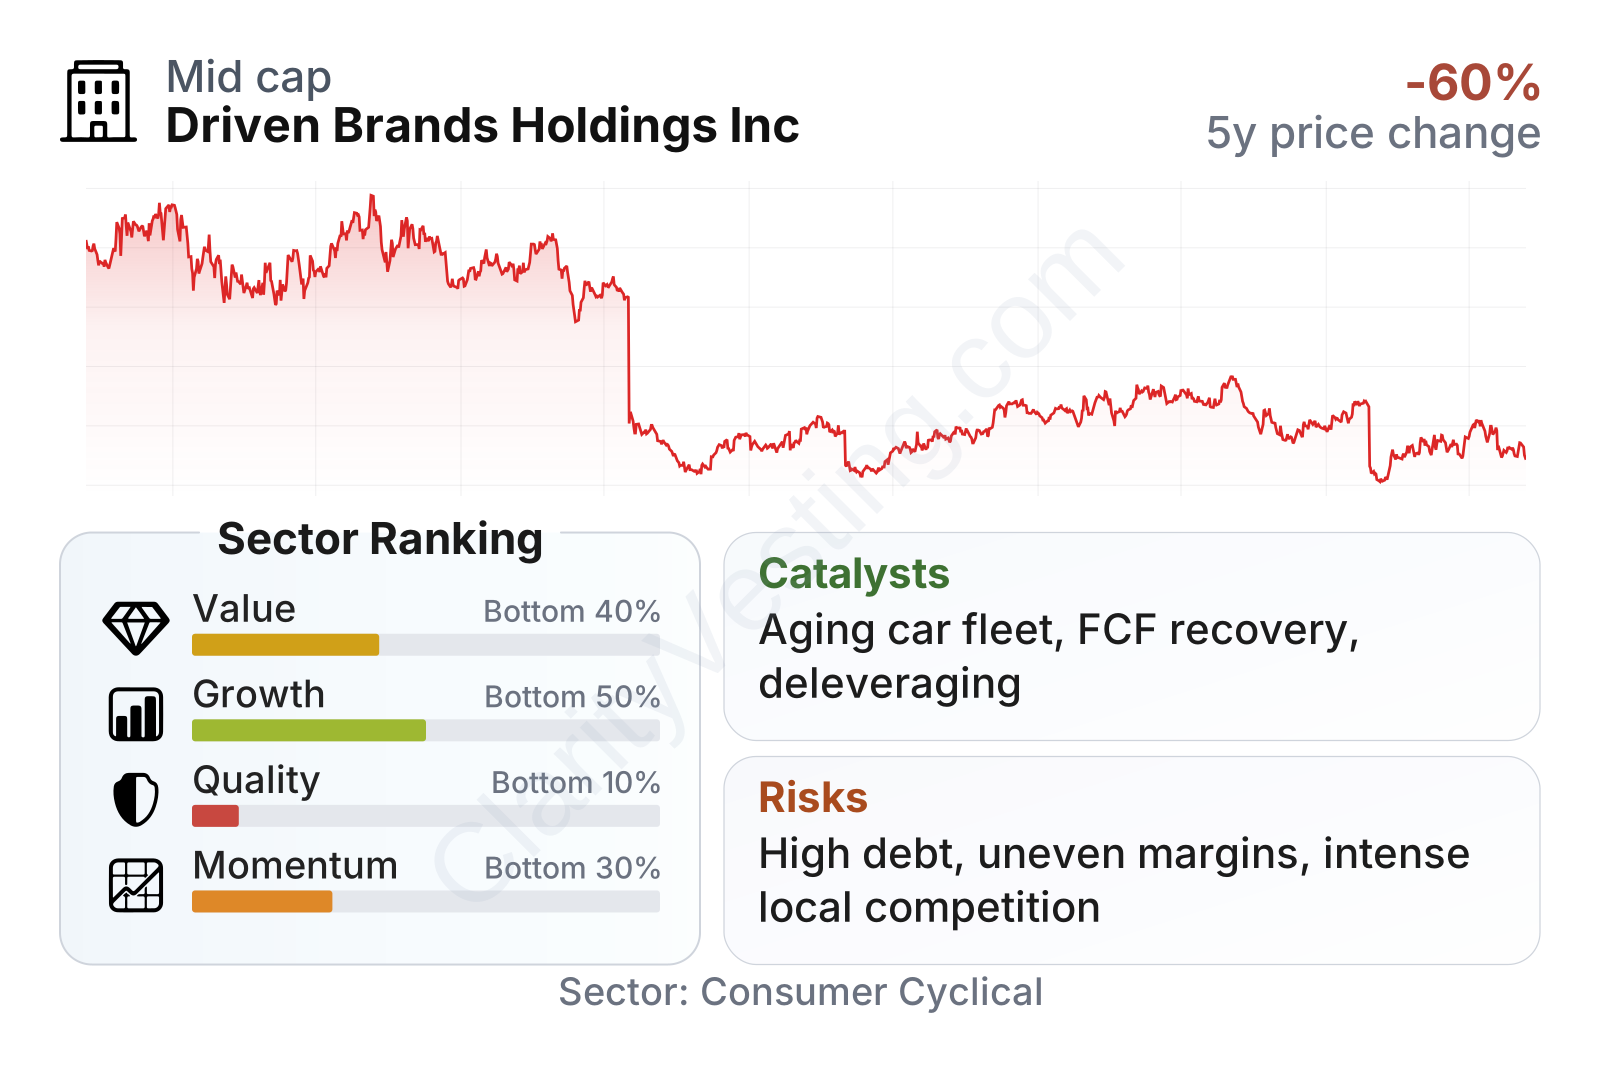
Driven Brands is a mid-sized public company with a stock that has been volatile since 2023. The recent metrics present a mixed picture. On valuation, the shares look cheaper than the sector median, with a P/E ratio in the low teens versus a sector median closer to the high teens, and the PEG ratio sits below 1. On growth, current year-over-year revenue growth is slightly above the sector median, but the longer five-year pattern is less impressive. The weakest area is business quality: leverage remains much higher than the sector norm, and return on invested capital has lagged badly. Profit margin has improved sharply and is now above the sector median, but that recovery still needs to prove it can last.
Growth
Driven Brands operates in a part of the auto market that has favorable long-term characteristics. The U.S. vehicle fleet is aging, and older vehicles generally require more maintenance, repairs, and replacement parts. That supports demand for oil changes, collision work, and glass repair. The company’s focus on non-discretionary services is important because it reduces dependence on new vehicle demand and gives the business exposure to recurring customer needs.
The strategy also makes sense on paper. Driven Brands combines franchised networks with company-operated stores, which can create scale in marketing, procurement, technology, and brand awareness. Its multi-brand structure allows it to serve different customer needs across the vehicle life cycle, from routine maintenance to accident-related repairs. That broad footprint can make cross-selling and local market density more valuable over time.
Revenue growth has been uneven. The company posted very strong expansion in 2021 and 2022, then growth slowed sharply, turned negative in parts of 2024 and 2026, and was distorted by large swings later on. The main takeaway is not steady compounding, but a business that has gone through acquisition effects, portfolio changes, and operational resets. That makes it harder to rely on top-line momentum alone.
Cash generation is showing signs of recovery, which is one of the more important positives. Free cash flow was negative in 2023 and 2024, near break-even in 2025, and turned clearly positive more recently. For a company with meaningful debt, improving free cash flow matters more than headline revenue growth because it gives management more flexibility to reduce leverage, invest in stores, and absorb economic pressure.
A significant catalyst in recent periods has been management’s emphasis on simplification, profitability, and balance-sheet improvement rather than pure expansion. If the company continues shifting from acquisition-led growth toward stronger store economics and steadier cash production, that could materially improve the long-term picture. Another favorable backdrop is that repair and maintenance demand tends to benefit from an older vehicle population, which remains a structural tailwind for the sector.
Risks
This article is for informational purposes only and does not constitute financial advice. Some content is AI-generated. See Disclaimer


