Stock Analysis · Dominos Pizza Group PLC (DPUKY)
Overview
Domino’s Pizza Group PLC is the master franchise operator for the Domino’s brand in the United Kingdom and Ireland. In simple terms, it runs the national platform behind the local Domino’s stores: it grants franchise rights, supports marketing, operates the supply chain, develops technology, and helps franchisees open and run stores. Most restaurants are operated by franchise partners rather than by the company itself, which makes the business less like a traditional restaurant chain and more like a brand-and-distribution platform built around pizza delivery and carryout.
Its revenue comes from a mix of franchise-related income and company-operated activities. Based on the company’s reporting structure and business model, the main sources are approximately:
- Supply chain sales to franchisees: roughly 55% to 65% of revenue. This includes food, ingredients, and other products sold into the store network.
- Franchise royalties and fees: roughly 20% to 30%. This generally includes ongoing royalties linked to store sales and other franchise-related charges.
- Company-owned stores and other income: roughly 10% to 20%. This includes sales from stores directly operated by the group and smaller ancillary income lines.
This mix matters because the supply business creates scale and recurring activity across the network, while royalties tend to be higher margin and more attractive when store sales are growing. Over the last several years, revenue has stayed in the mid-hundreds of millions of pounds, but profit conversion has moved around more than sales, showing that cost control and franchisee health remain important drivers of results.
Domino’s position in its market is strong. In the U.K. delivered pizza category, it is one of the best-known brands, supported by a large store base, heavy digital ordering, and a national advertising presence that is hard for smaller rivals to match.
The long-term pattern shows a business with fairly resilient revenue, but with earnings more sensitive to food costs, operating expenses, and financing costs. That is consistent with a franchise-led operator: the top line is relatively steady, while margins can improve or compress depending on execution.
Key Figures
| Metric | Value | Sector ⓘ |
|---|---|---|
| Date | Aug 22, 2026 | |
| Context | ||
| Sector | Consumer Cyclical | |
| Industry | Restaurants | |
| Market Cap ⓘ | $1.00B | |
| Beta ⓘ | 1.22 | |
Value (Cheapness) | ||
| P/E Ratio ⓘ | 12.52 | 18.08 |
| FCF Yield ⓘ | 16.44% | 8.40% |
| EBIT / EV ⓘ | N/A | 6.20% |
| PEG ⓘ | N/A | |
Growth (Business expansion) | ||
| Revenue Growth ⓘ | 6.70% | 5.80% |
| RPS Growth (5Y CAGR) ⓘ | 9.05% | 9.06% |
| EPS Growth (5Y CAGR) ⓘ | -17.26% | -17.87% |
| Margin Growth (5Y Trend) ⓘ | -3.92% | -0.31% |
| FCF Growth (5Y CAGR) ⓘ | -9.11% | 4.91% |
Quality (Business durability) | ||
| ROIC (Latest) ⓘ | 268.58% | 12.33% |
| ROIC (5Y Median) ⓘ | 44.64% | 10.78% |
| Net Debt / EBIT (Latest) ⓘ | 2.10 | 2.16 |
| Net Debt / EBIT (5Y Median) ⓘ | 4.33 | 2.31 |
| Operating Margin (Latest) ⓘ | 18.23% | 9.14% |
| Operating Margin (5Y Median) ⓘ | 17.02% | 9.64% |
| Debt to Equity (Latest) ⓘ | -656.99% | 75.06% |
| Profit Margin (Latest) ⓘ | 8.40% | 5.30% |
| Free Cash Flow (Latest) ⓘ | $164.83M | |
Momentum (Price trend) | ||
| 3Y Return ⓘ | -39.29% | +20.19% |
| 12M Return (excl. last month) ⓘ | -15.73% | +0.43% |
| 6M Return ⓘ | +3.58% | -2.19% |
| Price vs. 200-Day MA ⓘ | +10.31% | +2.39% |
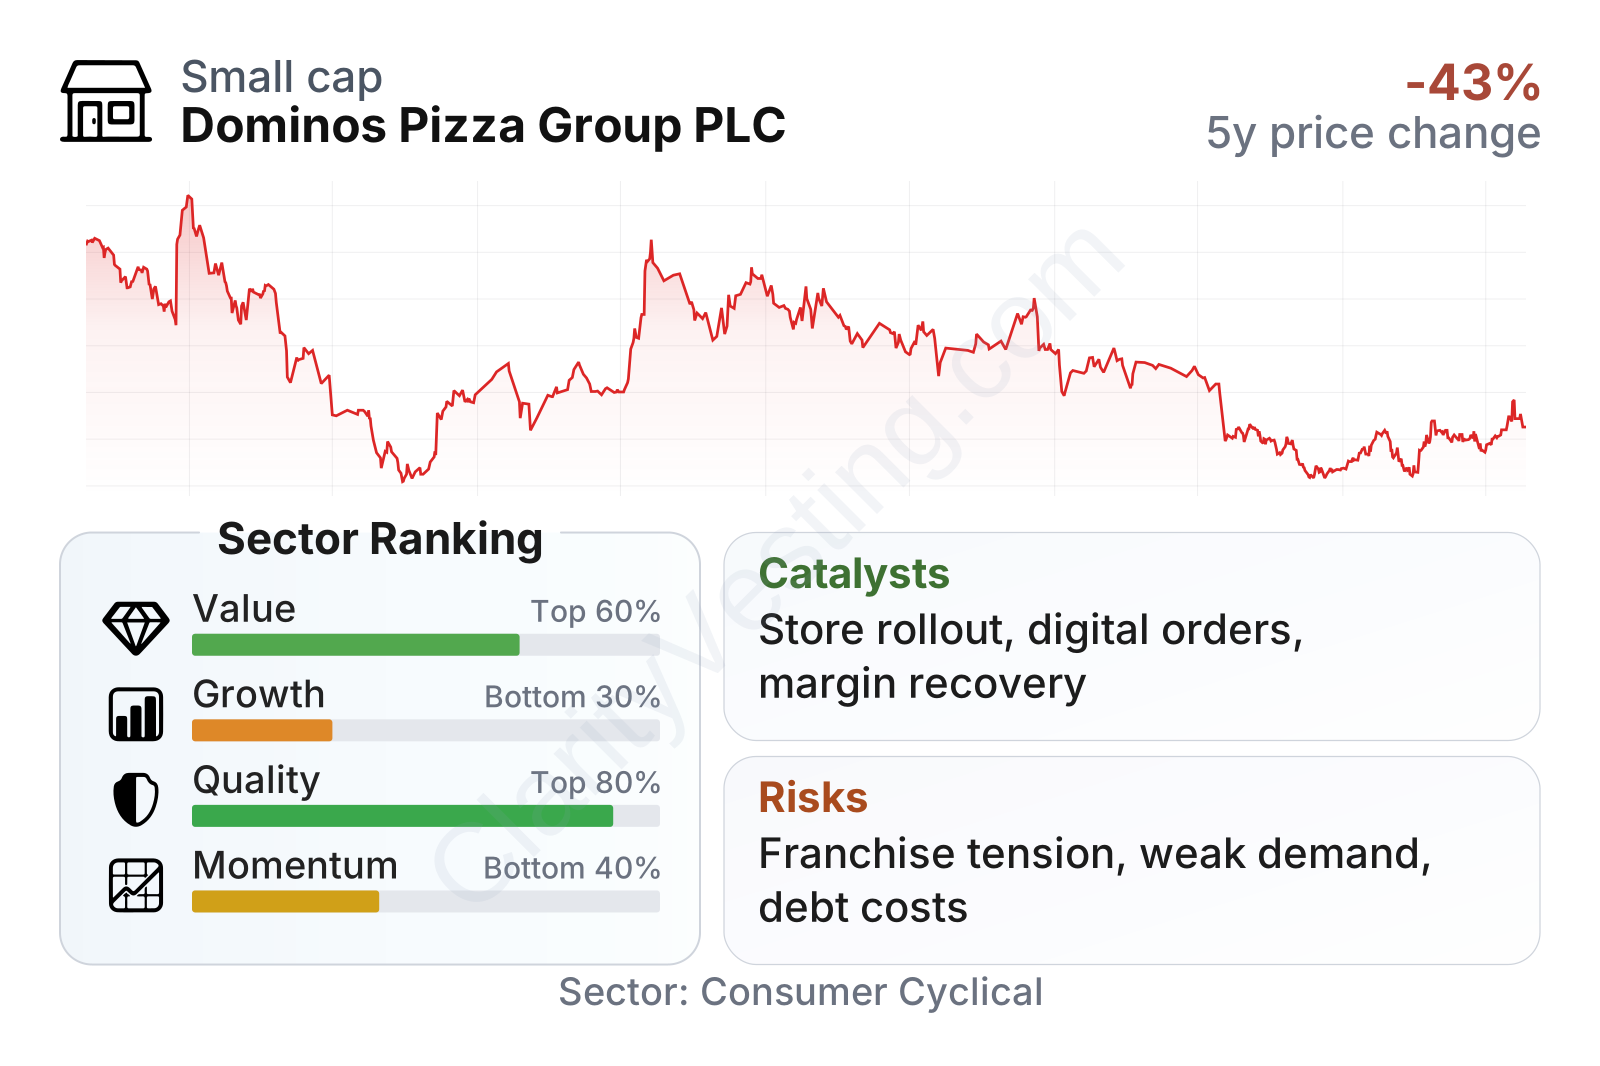
The overall picture is mixed but understandable. The company screens well on quality and reasonably well on value, while growth and longer-term share price momentum are weaker. Profitability stands above many restaurant peers, with operating margin around the high teens and profit margin above the sector median. Free cash flow generation is also strong relative to the current market value. On the other hand, revenue growth has been modest, free cash flow has not grown smoothly over a five-year view, and leverage still deserves attention even though debt pressure appears lower than it was at its previous peak.
The balance sheet needs careful interpretation. The negative debt-to-equity reading is usually a sign of negative book equity rather than the absence of debt. For practical analysis, cash generation and debt relative to earnings are more informative here than equity-based leverage ratios alone.
Growth
The company operates in a part of the restaurant industry that still has structural support. Delivered food, app-based ordering, loyalty offers, and convenience-led eating habits remain established consumer behaviors. Pizza also travels well, which helps the category fit delivery economics better than many other cuisines. That said, this is not a fast-growth market in the same way as an early-stage technology segment. It is a mature consumer business where growth tends to come from store expansion, better digital conversion, stronger average order values, and market share gains rather than from explosive demand.
Domino’s strategy broadly makes sense for that environment. The group benefits when franchisees open more stores, when system sales rise, and when customers stay within its digital ecosystem. Its scale in marketing, procurement, and logistics gives it tools that many smaller competitors cannot easily replicate. If management can improve franchisee economics and maintain disciplined promotions, the model can still produce steady expansion even without dramatic industry growth.
Recent growth has looked modest rather than dynamic. The latest revenue growth rate is around the mid-single-digit range, slightly below the sector median. Over a five-year period, revenue per share has advanced at a healthy pace, but earnings and cash flow trends have been less smooth. That suggests a company with demand resilience, but also with some friction between sales growth and bottom-line delivery.
Free cash flow remains one of the more encouraging parts of the picture. The business is producing a sizable amount of annual cash relative to its market value, which can support dividends, debt management, reinvestment, and selective shareholder returns. For a franchised restaurant platform, that cash conversion is important because it helps offset the slower growth profile.
A meaningful catalyst is the combination of network development and digital execution. More stores can improve delivery coverage and convenience, while digital upgrades can increase order frequency and reduce friction for repeat customers. Another potential catalyst is margin recovery if input cost pressure stays manageable and financing costs stop rising. In a business with already solid operating margins, even moderate efficiency gains can have an outsized effect on earnings.
Risks
This article is for informational purposes only and does not constitute financial advice. Some content is AI-generated. See Disclaimer