Stock Analysis · Dlocal Ltd (DLO)
Overview
dLocal is a cross-border payments company focused on emerging markets. In simple terms, it helps global businesses accept payments from customers and send payouts to people or businesses in countries where local payment systems are fragmented, hard to integrate, or heavily regulated. Its platform is designed to let a merchant connect once and then access many countries, payment methods, and compliance tools through a single provider.
The business mainly serves large international merchants operating in areas such as e-commerce, digital subscriptions, travel, software, financial services, and online marketplaces. The value proposition is straightforward: instead of building separate payment connections country by country, a client can use dLocal to reach consumers in Latin America, Africa, Asia, and other developing regions with local cards, bank transfers, wallets, and cash-based options where relevant.
Revenue comes primarily from transaction-related fees. Based on company disclosures, the main sources are:
- Pay-ins from merchants accepting local payments: the largest revenue source, estimated at more than 70% of revenue. This includes payment processing for card payments, bank transfers, digital wallets, and other local methods used by consumers.
- Payouts and disbursements: estimated at 10% to 25% of revenue. This covers sending funds to individuals or businesses, such as marketplace sellers, creators, contractors, or remittance recipients.
- Foreign-exchange and other service-related income: estimated at less than 15% of revenue. This can include conversion spreads, settlement services, and related payment infrastructure support.
dLocal does not publish a simple revenue split that breaks every stream into neat percentages each quarter, but company filings consistently show that payment processing activity is the core engine and that revenue scales with total payment volume, merchant mix, country mix, and take rates.
The broader financial picture shows a business that has expanded revenue quickly over the last several years while remaining profitable, although costs tied to processing and operating expansion have also increased as the company entered more markets and served larger merchants.
The long-term pattern is clear: revenue has risen sharply since 2021, gross profit has also grown, and operating income remains substantial even after heavier spending on sales, administration, and product development. That combination suggests scaling is real, even if margins are not as high as they were in the company’s earlier years.
Key Figures
| Metric | Value | Sector ⓘ |
|---|---|---|
| Date | Sep 12, 2026 | |
| Context | ||
| Sector | Technology | |
| Industry | Software - Infrastructure | |
| Market Cap ⓘ | $4.39B | |
| Beta ⓘ | 0.87 | |
Value (Cheapness) | ||
| P/E Ratio ⓘ | 21.62 | 29.51 |
| FCF Yield ⓘ | 9.65% | 4.25% |
| EBIT / EV ⓘ | 6.74% | 2.85% |
| PEG ⓘ | N/A | |
Growth (Business expansion) | ||
| Revenue Growth ⓘ | 55.80% | 15.40% |
| RPS Growth (5Y CAGR) ⓘ | 45.49% | 8.56% |
| EPS Growth (5Y CAGR) ⓘ | 0.83% | -11.88% |
| Margin Growth (5Y Trend) ⓘ | -14.15% | 0.46% |
| FCF Growth (5Y CAGR) ⓘ | 62.52% | 9.80% |
Quality (Business durability) | ||
| ROIC (Latest) ⓘ | 33.78% | 9.44% |
| ROIC (5Y Median) ⓘ | 32.98% | 8.30% |
| Net Debt / EBIT (Latest) ⓘ | -3.13 | 0.54 |
| Net Debt / EBIT (5Y Median) ⓘ | -1.46 | 0.44 |
| Operating Margin (Latest) ⓘ | 17.12% | 9.58% |
| Operating Margin (5Y Median) ⓘ | 27.54% | 8.25% |
| Debt to Equity (Latest) ⓘ | 12.47% | 33.33% |
| Profit Margin (Latest) ⓘ | 15.04% | 7.14% |
| Free Cash Flow (Latest) ⓘ | $423.77M | |
Momentum (Price trend) | ||
| 3Y Return ⓘ | -25.40% | +45.48% |
| 12M Return (excl. last month) ⓘ | +32.36% | +23.48% |
| 6M Return ⓘ | +30.82% | +20.93% |
| Price vs. 200-Day MA ⓘ | +11.45% | +7.43% |
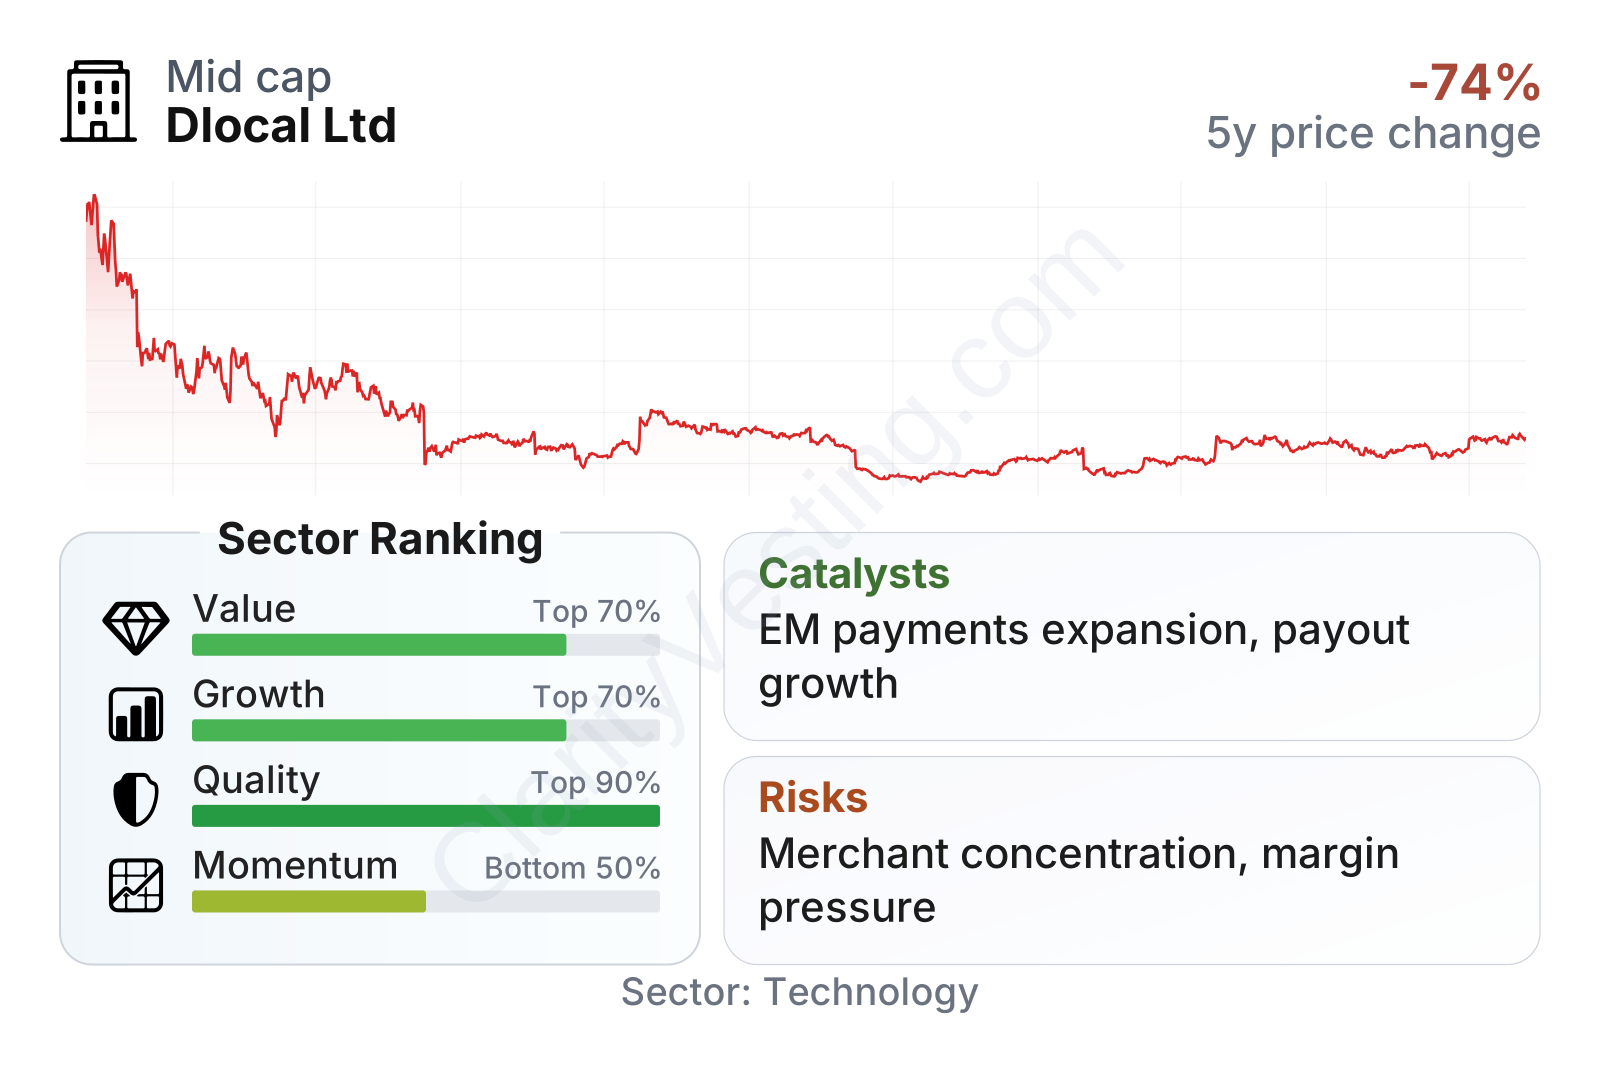
dLocal sits in the mid-cap range, with lower share-price volatility than many technology names. The most striking feature in the metrics is quality: returns on invested capital are far above the sector median, profitability remains clearly above peers, and the balance sheet is exceptionally clean with almost no leverage. Growth metrics are also strong, especially for revenue and free cash flow over multi-year periods, while valuation looks less demanding than much of the software universe. The weaker area is market momentum over a longer horizon, reflecting the stock’s volatile history since its post-IPO years.
The stock chart shows that the market has dramatically changed its view of dLocal since 2021. After a steep decline from its early public-market valuation, the shares have traded at much lower levels despite the business continuing to grow. That gap between operating progress and stock performance is a major part of the current investment debate.
Growth
dLocal operates in a segment with favorable long-term tailwinds. Digital commerce continues to expand, and many emerging markets are still underpenetrated in online payments, banking access, and modern checkout infrastructure. At the same time, global companies increasingly want local payment acceptance and payout capabilities in countries where international card penetration is limited and domestic methods dominate. That creates a practical need for a provider that already has local integrations, regulatory know-how, and settlement capabilities.
The company’s strategy is logical for this environment. Instead of competing head-on in the most saturated developed markets, dLocal focuses on places where payment complexity is higher and where a single integration can save merchants a meaningful amount of time and operational effort. This specialization can make the platform more relevant than broad payment processors that are stronger in North America or Europe but less tailored to emerging economies.
Growth has not been perfectly smooth, but the trend is still impressive. Revenue growth was extremely high in the company’s early public years, slowed materially during 2024, and then reaccelerated to roughly the mid-50% range most recently. That rebound matters because it suggests the earlier slowdown was not simply the start of a permanent deceleration. It also stands far above the sector median growth rate.
Cash generation is another important point. Free cash flow has climbed strongly over time, with one unusually weak point before a sharp recovery to around $400 million on a trailing basis. For a company of this size, that is a meaningful level of internally generated cash and gives dLocal flexibility to invest in product development, geographic expansion, partnerships, or balance-sheet protection without depending heavily on borrowing.
Recent company communications have continued to emphasize expansion of payment methods, new geographic coverage, and deeper relationships with large enterprise customers. Those developments matter because the company’s model benefits from scale: once a merchant is integrated, adding more countries and more payment flows through the same platform can deepen the relationship and raise switching costs.
A major catalyst is the ongoing shift of global merchants toward emerging-market revenue. If international brands, digital platforms, and online marketplaces keep pushing into Latin America, Africa, and Asia, dLocal stands in a useful position as the connective layer between those merchants and local financial systems. Another catalyst is broader adoption of payout use cases, which can expand the platform beyond simple checkout processing.
Risks
This article is for informational purposes only and does not constitute financial advice. Some content is AI-generated. See Disclaimer


