Stock Analysis · Dream Finders Homes Inc (DFH)
Overview
Dream Finders Homes Inc is a U.S. homebuilder focused on designing, building, and selling single-family homes. The company operates across multiple states and generally targets entry-level, first move-up, second move-up, and active adult buyers. Its model has stood out in the homebuilding industry because it has historically used an asset-lighter land strategy than many peers, often controlling lots through options rather than owning all land far in advance. That can reduce upfront capital needs, although it does not remove the cyclical risk of the housing market.
The business makes most of its money from home closings, meaning revenue is recognized when homes are delivered to buyers. Based on recent annual filings, revenue is concentrated in homebuilding, with smaller contributions from related services and land activity.
- Home sales: approximately 95% to 98% of revenue. This includes the sale of completed homes and homes built under contract for buyers across the company’s operating markets.
- Lot and land sales: approximately 1% to 3% of revenue. This covers sales of land parcels or lots that are not retained for future homebuilding.
- Financial services and other revenue: approximately 1% to 2% of revenue. This generally includes mortgage-related and title-related activities where available, along with other ancillary items.
Over the last several years, the company expanded rapidly, with total revenue rising from roughly $1.9 billion in 2021 to about $4.5 billion in 2024 before easing modestly in 2025. That pattern shows a builder that scaled aggressively, but also one now feeling the pressure of a slower affordability environment.
The business mix also shows an important shift in profitability. Revenue climbed sharply through 2024, while cost of revenue and selling expenses also grew. In 2025, sales slipped and profitability compressed more noticeably, as higher operating costs and heavier interest expense reduced the amount of earnings flowing to shareholders.
Key Figures
| Metric | Value | Sector ⓘ |
|---|---|---|
| Date | Sep 12, 2026 | |
| Context | ||
| Sector | Consumer Cyclical | |
| Industry | Residential Construction | |
| Market Cap ⓘ | $1.11B | |
| Beta ⓘ | 1.91 | |
Value (Cheapness) | ||
| P/E Ratio ⓘ | 8.52 | 17.10 |
| FCF Yield ⓘ | -14.56% | 8.53% |
| EBIT / EV ⓘ | 3.87% | 6.46% |
| PEG ⓘ | N/A | |
Growth (Business expansion) | ||
| Revenue Growth ⓘ | -7.60% | 5.75% |
| RPS Growth (5Y CAGR) ⓘ | 19.69% | 9.14% |
| EPS Growth (5Y CAGR) ⓘ | -41.25% | -18.21% |
| Margin Growth (5Y Trend) ⓘ | -1.89% | -0.23% |
| FCF Growth (5Y CAGR) ⓘ | N/A | 4.91% |
Quality (Business durability) | ||
| ROIC (Latest) ⓘ | 2.63% | 12.61% |
| ROIC (5Y Median) ⓘ | 17.29% | 10.72% |
| Net Debt / EBIT (Latest) ⓘ | 3.52 | 2.10 |
| Net Debt / EBIT (5Y Median) ⓘ | 1.76 | 2.32 |
| Operating Margin (Latest) ⓘ | 2.67% | 9.25% |
| Operating Margin (5Y Median) ⓘ | 9.84% | 9.64% |
| Debt to Equity (Latest) ⓘ | 37.48% | 75.78% |
| Profit Margin (Latest) ⓘ | 3.55% | 5.33% |
| Free Cash Flow (Latest) ⓘ | -$161.75M | |
Momentum (Price trend) | ||
| 3Y Return ⓘ | -54.22% | +14.53% |
| 12M Return (excl. last month) ⓘ | -44.59% | +3.08% |
| 6M Return ⓘ | -17.09% | +0.55% |
| Price vs. 200-Day MA ⓘ | -24.14% | -0.54% |
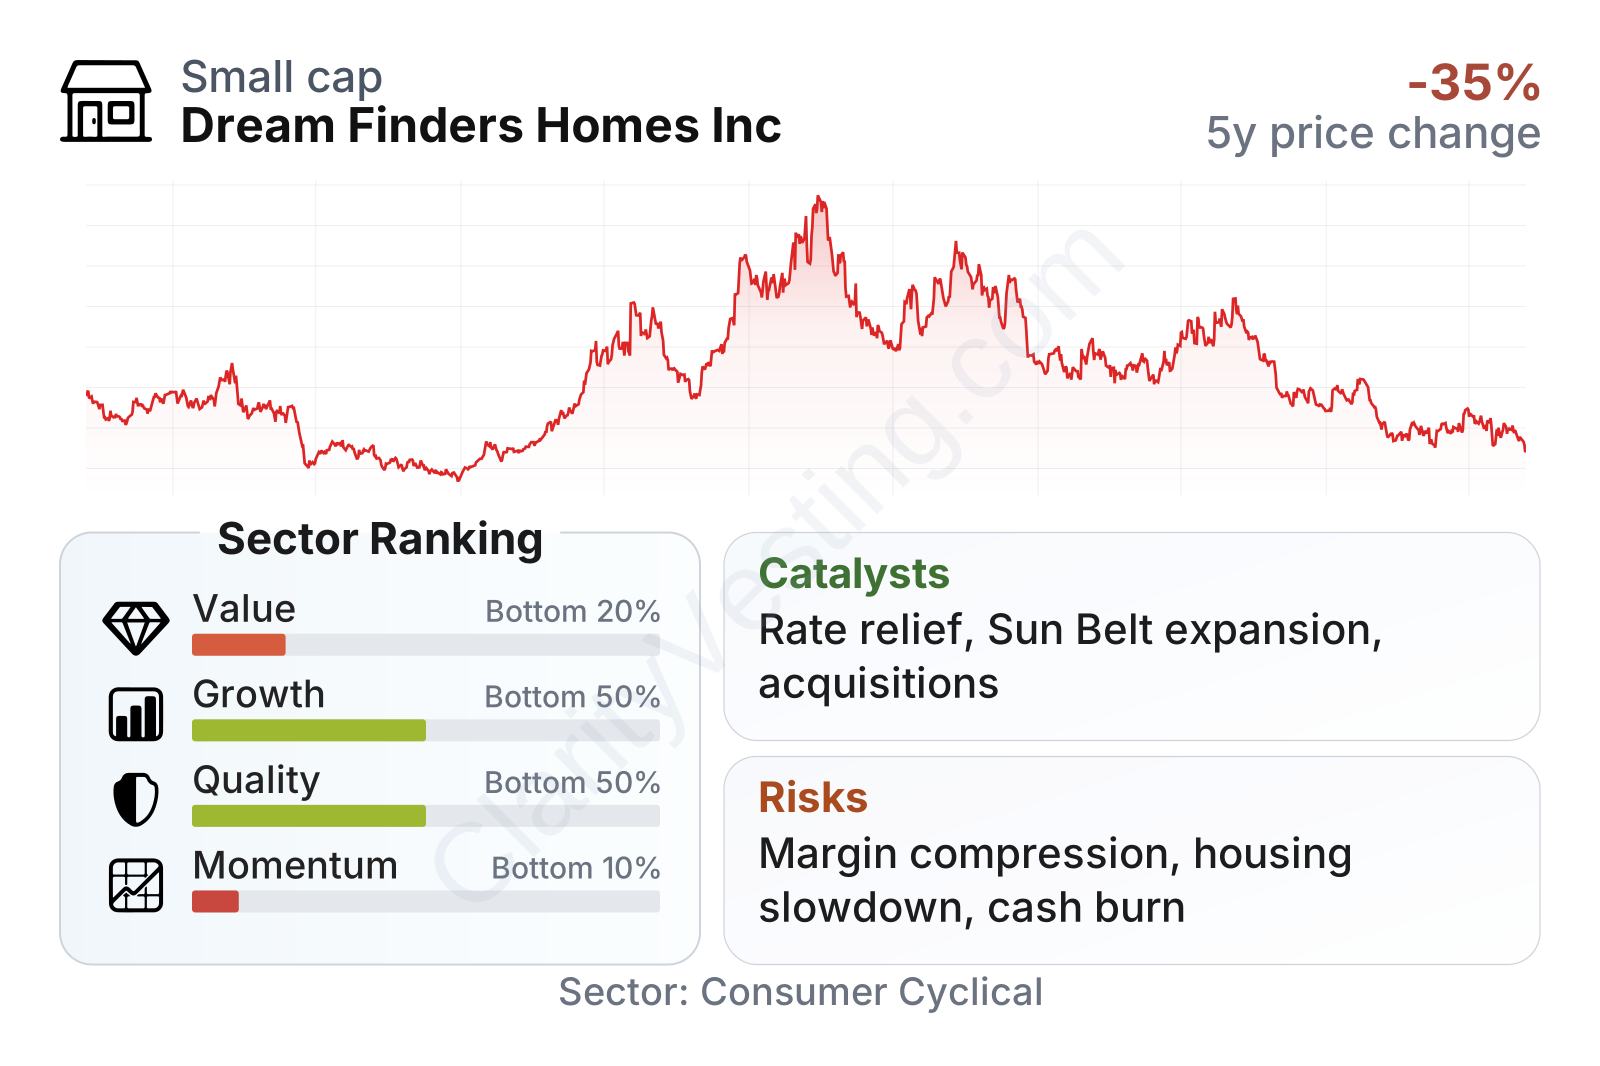
Dream Finders is a relatively small public company within the broader consumer cyclical universe, with a market value a little above $1 billion. The table points to a mixed profile. On valuation, the stock trades at a single-digit earnings multiple, well below the sector median, which suggests the market is assigning a discount to the business. On the other hand, the broader factor picture is weaker: growth and quality rank in the lower half of the sector, and momentum is particularly weak after a sharp share price decline over the last year. The stock also carries a high beta, meaning it has tended to move more sharply than the market.
The share price history highlights how volatile homebuilder stocks can be. Dream Finders moved from the low teens to above $30 at points over the last few years, then fell back materially by mid-2026. That kind of swing usually reflects changing expectations around mortgage rates, housing demand, margins, and the pace of community expansion rather than a simple shift in sentiment alone.
Growth
Homebuilding is a cyclical industry, but the long-term sector backdrop still has supportive elements. The U.S. continues to face a structural housing shortage in many markets, and resale inventory has often remained constrained. That creates room for builders that can deliver affordable or relatively affordable new homes in desirable regions. Dream Finders has positioned itself in many Sun Belt and high-growth markets, which gives it exposure to migration trends and areas where housing demand has generally been healthier than the national average over time.
Its expansion strategy has also been clear: enter new markets, scale through acquisitions and local brands, and maintain flexibility in land control. Over a five-year view, that approach produced strong top-line growth. Revenue per share growth over that period has been much stronger than the sector median, which shows that the company has not only grown by size, but has also expanded meaningfully on a per-share basis. The challenge is that more recent growth has slowed and then turned negative, reflecting a tougher operating environment.
The revenue trend shows a business that moved from exceptional post-pandemic expansion to contraction. Year-over-year growth was extremely strong in 2021 and 2022, remained positive through most of 2024 and early 2025, and then turned negative by late 2025 and into 2026. That reversal matters because it suggests Dream Finders is no longer benefiting from the same volume and pricing tailwinds that helped many builders during the housing boom.
Cash generation also deserves attention. Homebuilders often swing between positive and negative free cash flow as they invest in land, development, and inventory. In Dream Finders’ case, free cash flow was positive in 2023 and 2024, then turned negative again in 2025 and remained negative into 2026. That does not automatically signal distress, but it does indicate that current growth and inventory positioning are consuming cash rather than releasing it.
A meaningful catalyst is any future easing in mortgage rates or stabilization in affordability. Lower financing costs can quickly improve monthly payments for buyers and help conversion rates, especially in entry-level and move-up categories. Another catalyst is continued integration of acquired operations and geographic diversification. If management can protect volumes while recovering margins, the earnings profile could improve faster than revenue alone would suggest. Recent company communications have also emphasized market expansion and community growth, which remain important if demand normalizes.
Risks
This article is for informational purposes only and does not constitute financial advice. Some content is AI-generated. See Disclaimer


