Stock Analysis · Dave Inc (DAVE)
Overview
Dave Inc operates a mobile financial services platform focused on consumers who want simpler tools for everyday money management. Its app combines short-term liquidity products, banking-related features, personal financial tools, and a marketplace that helps users compare switching opportunities such as insurance. The company’s original identity was built around helping users avoid overdraft fees, and it has expanded that position into a broader digital finance platform aimed at people underserved by traditional banks.
Based on recent company filings, Dave’s revenue is primarily generated from service-based fees and partner-related financial services activity rather than from traditional lending spread income. The mix can shift over time, but the main sources appear to be:
- Transaction-based and service revenue from ExtraCash advances and related fees: approximately 45% to 55% of revenue. This includes fees tied to short-term cash advances and associated services.
- Origination and marketplace-related revenue: approximately 20% to 30%. This includes revenue from connecting users to financial products and from the company’s newer comparison marketplace activities.
- Subscription and card-related revenue: approximately 10% to 20%. This includes membership fees, interchange from debit card spending, and other banking-service economics.
- Other revenue: a smaller remainder, generally below 10%, including miscellaneous platform-related income.
What matters most for long-term analysis is that Dave is no longer just a niche overdraft-alternative app. It is trying to become a scaled consumer finance platform with multiple monetization levers, while keeping a relatively asset-light operating model compared with a traditional lender.
The business model has improved meaningfully over the last several years. Revenue has expanded strongly, gross profit has widened, and operating costs have grown far more slowly than sales. That shift turned heavy losses in earlier years into substantial operating profit and net income more recently, which is one of the most important changes in the company’s profile.
Key Figures
| Metric | Value | Sector ⓘ |
|---|---|---|
| Date | Sep 12, 2026 | |
| Context | ||
| Sector | Technology | |
| Industry | Software - Application | |
| Market Cap ⓘ | $4.57B | |
| Beta ⓘ | 3.84 | |
Value (Cheapness) | ||
| P/E Ratio ⓘ | 23.09 | 29.51 |
| FCF Yield ⓘ | 7.14% | 4.25% |
| EBIT / EV ⓘ | 6.20% | 2.85% |
| PEG ⓘ | N/A | |
Growth (Business expansion) | ||
| Revenue Growth ⓘ | 29.60% | 15.40% |
| RPS Growth (5Y CAGR) ⓘ | 30.58% | 8.56% |
| EPS Growth (5Y CAGR) ⓘ | N/A | -11.88% |
| Margin Growth (5Y Trend) ⓘ | N/A | 0.46% |
| FCF Growth (5Y CAGR) ⓘ | N/A | 9.80% |
Quality (Business durability) | ||
| ROIC (Latest) ⓘ | 60.31% | 9.44% |
| ROIC (5Y Median) ⓘ | -10.36% | 8.30% |
| Net Debt / EBIT (Latest) ⓘ | 0.20 | 0.54 |
| Net Debt / EBIT (5Y Median) ⓘ | N/A | 0.44 |
| Operating Margin (Latest) ⓘ | 44.62% | 9.58% |
| Operating Margin (5Y Median) ⓘ | -11.34% | 8.25% |
| Debt to Equity (Latest) ⓘ | 129.14% | 33.33% |
| Profit Margin (Latest) ⓘ | 34.59% | 7.14% |
| Free Cash Flow (Latest) ⓘ | $326.54M | |
Momentum (Price trend) | ||
| 3Y Return ⓘ | +5379.84% | +45.48% |
| 12M Return (excl. last month) ⓘ | +71.25% | +23.48% |
| 6M Return ⓘ | +64.77% | +20.93% |
| Price vs. 200-Day MA ⓘ | +33.14% | +7.43% |
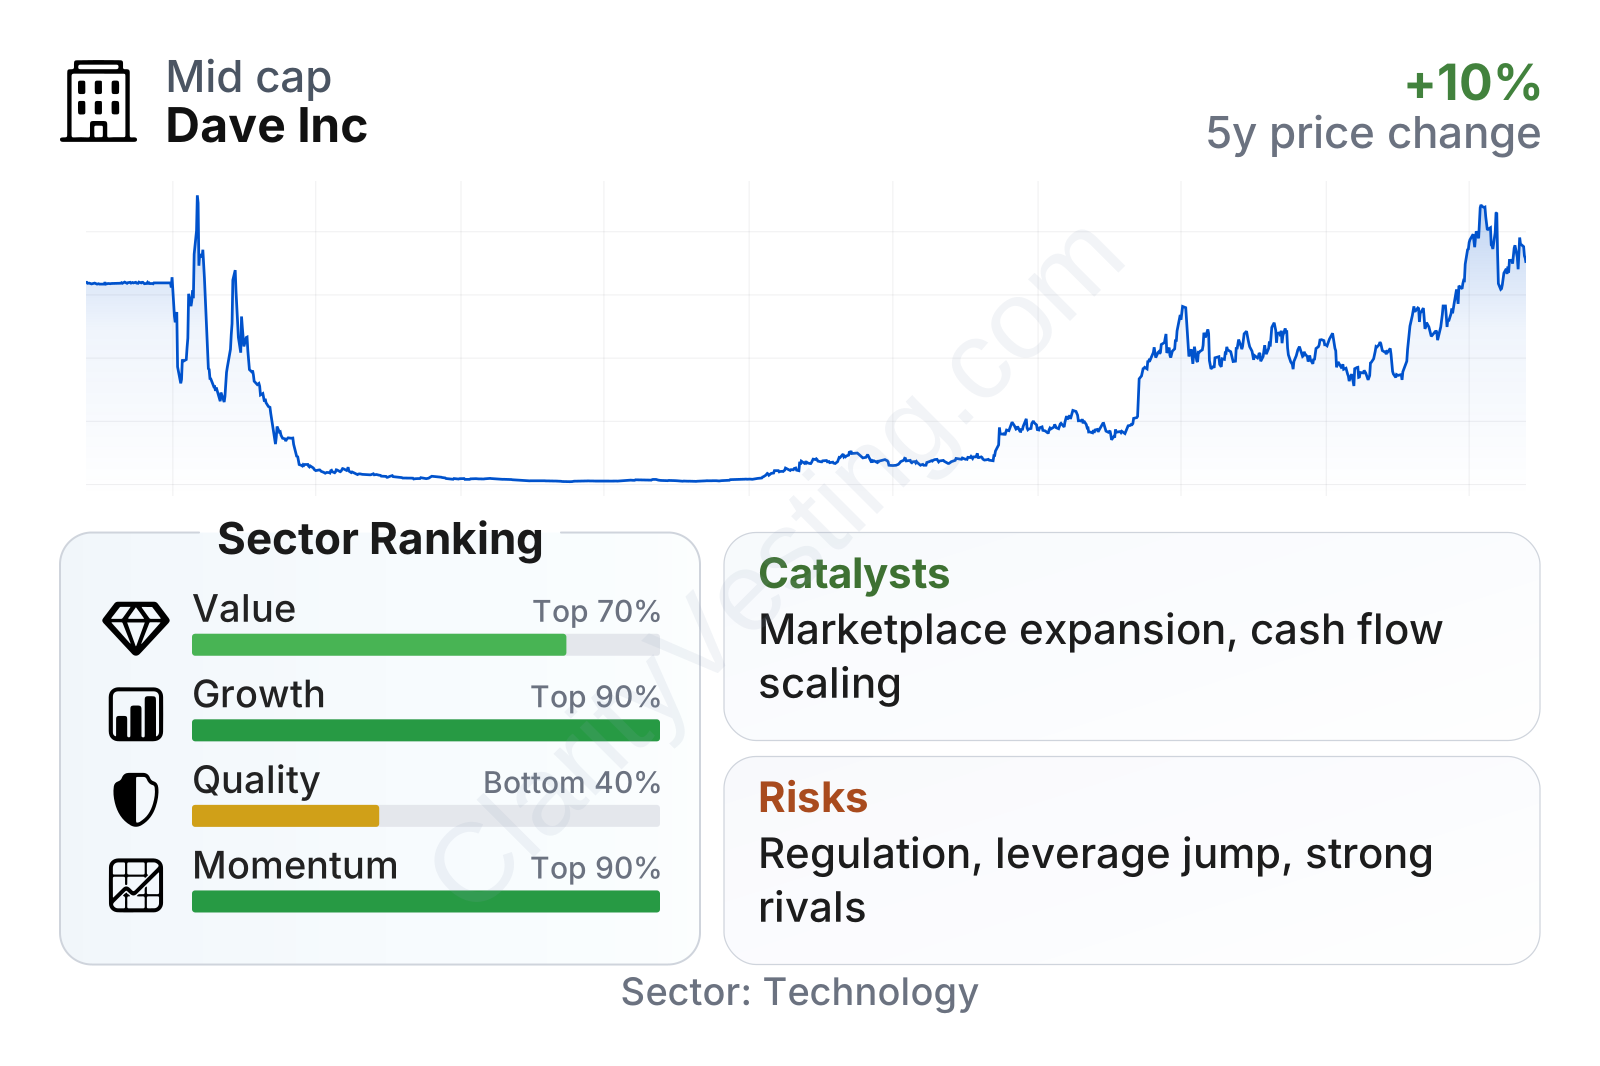
Dave is now a mid-sized public company by market value, but the stock remains unusually volatile, with a beta far above the broader market. In fundamentals, the strongest areas are growth and momentum, both ranking well above much of the software sector. Value also looks favorable, with earnings and cash flow multiples below sector medians and a free cash flow yield clearly above typical peers. The weaker area is quality, not because current profitability is poor, but because the longer-term record is uneven and leverage has recently moved higher again.
Growth
Dave operates in a large and still-developing digital personal finance market. Demand for fast access to cash, mobile-first banking tools, and fee-conscious alternatives to traditional banking remains strong, especially among younger and lower-to-middle income users. That gives the company exposure to a category that is still gaining adoption rather than one that is already mature.
The strategy for future expansion is coherent. Dave is trying to deepen engagement inside one app instead of relying on a single product. That matters because a user who takes advances, uses a card, keeps deposits on the platform, and shops through the marketplace is likely more valuable than a user who only uses one feature occasionally. Cross-selling can also improve economics without requiring the same level of marketing spend for every additional product.
Growth has been rapid. Year-over-year revenue expansion accelerated sharply through 2024 and 2025 before cooling in 2026, but even the latest pace remains strong at roughly 30%, still well above the sector median of about 16%. That suggests the company is moving from hypergrowth toward a more normalized, but still high-growth, phase rather than stalling outright.
Cash generation has improved even more dramatically than sales. Free cash flow was negative a few years ago, turned positive in 2024, and then rose steeply into 2025 and 2026. This is important because it suggests the company’s recent profitability is not purely an accounting result; the business is increasingly converting expansion into real cash.
A notable catalyst is the company’s continued buildout of its marketplace and cash-flow-underwriting capabilities. If Dave can keep improving underwriting while increasing user conversion across advances, banking activity, and comparison products, revenue per customer could keep rising without the business becoming a traditional balance-sheet-heavy lender. Recent investor communications have also highlighted continued member growth, stronger engagement, and scaling economics, all of which support the idea that the platform is reaching a more efficient stage.
Risks
This article is for informational purposes only and does not constitute financial advice. Some content is AI-generated. See Disclaimer


