Stock Analysis · Caesars Entertainment Corporation (CZR)
Overview
Caesars Entertainment Corporation is one of the largest casino and hospitality operators in the United States. The company owns, leases, brands, or manages a broad portfolio of gaming properties, with a strong presence in Las Vegas and many regional markets. Its business combines casino gaming, hotel rooms, food and beverage, entertainment, meetings and conventions, and online sports betting and iGaming through Caesars Digital. The Caesars Rewards loyalty program is a central part of the model because it helps the company keep customers inside its ecosystem across physical casinos, hotels, and digital platforms.
Revenue is spread across land-based gaming, non-gaming hospitality, and digital operations. Based on recent annual reporting, the business mix is approximately as follows:
- Casino and other gaming revenue: about 55% to 60% of total revenue. This is the core activity and includes slot machines, table games, poker, retail sports betting, and related gaming activity at Caesars properties.
- Rooms, food and beverage, and entertainment: about 20% to 25%. This includes hotel stays, restaurants, bars, live shows, nightlife, and other on-property guest spending.
- Management fees, licensing, and other property-related revenue: about 10% to 15%. This includes branded property agreements, management contracts, and other operating revenue tied to the broader Caesars network.
- Digital operations: about 8% to 12%. This includes online sports betting and online casino gaming, primarily under the Caesars Sportsbook and iCasino offerings.
The main point for long-term readers is that Caesars is not just a casino floor operator. It is a diversified gaming and hospitality platform with a major loyalty program, valuable real estate access, and a digital arm that gives it exposure to the shift toward online betting.
The business has grown revenue meaningfully since 2021, but the flow from revenue to net income shows a recurring pressure point: interest expense remains very large. Operating income has generally held up better than net income, which means the core properties can produce solid earnings before financing costs, while the capital structure still weighs on final profitability.
Key Figures
| Metric | Value | Sector ⓘ |
|---|---|---|
| Date | Sep 12, 2026 | |
| Context | ||
| Sector | Consumer Cyclical | |
| Industry | Resorts & Casinos | |
| Market Cap ⓘ | $6.04B | |
| Beta ⓘ | 1.75 | |
Value (Cheapness) | ||
| P/E Ratio ⓘ | N/A | 17.10 |
| FCF Yield ⓘ | 10.10% | 8.53% |
| EBIT / EV ⓘ | 6.24% | 6.46% |
| PEG ⓘ | 3.26 | |
Growth (Business expansion) | ||
| Revenue Growth ⓘ | 3.00% | 5.75% |
| RPS Growth (5Y CAGR) ⓘ | 5.04% | 9.14% |
| EPS Growth (5Y CAGR) ⓘ | -26.96% | -18.21% |
| Margin Growth (5Y Trend) ⓘ | 5.44% | -0.23% |
| FCF Growth (5Y CAGR) ⓘ | -5.50% | 4.91% |
Quality (Business durability) | ||
| ROIC (Latest) ⓘ | 9.52% | 12.61% |
| ROIC (5Y Median) ⓘ | 9.27% | 10.72% |
| Net Debt / EBIT (Latest) ⓘ | 12.75 | 2.10 |
| Net Debt / EBIT (5Y Median) ⓘ | 13.57 | 2.32 |
| Operating Margin (Latest) ⓘ | 16.03% | 9.25% |
| Operating Margin (5Y Median) ⓘ | 16.33% | 9.64% |
| Debt to Equity (Latest) ⓘ | 736.47% | 75.78% |
| Profit Margin (Latest) ⓘ | -3.99% | 5.33% |
| Free Cash Flow (Latest) ⓘ | $610.00M | |
Momentum (Price trend) | ||
| 3Y Return ⓘ | -44.87% | +14.53% |
| 12M Return (excl. last month) ⓘ | +20.25% | +3.08% |
| 6M Return ⓘ | +4.44% | +0.55% |
| Price vs. 200-Day MA ⓘ | +11.24% | -0.54% |
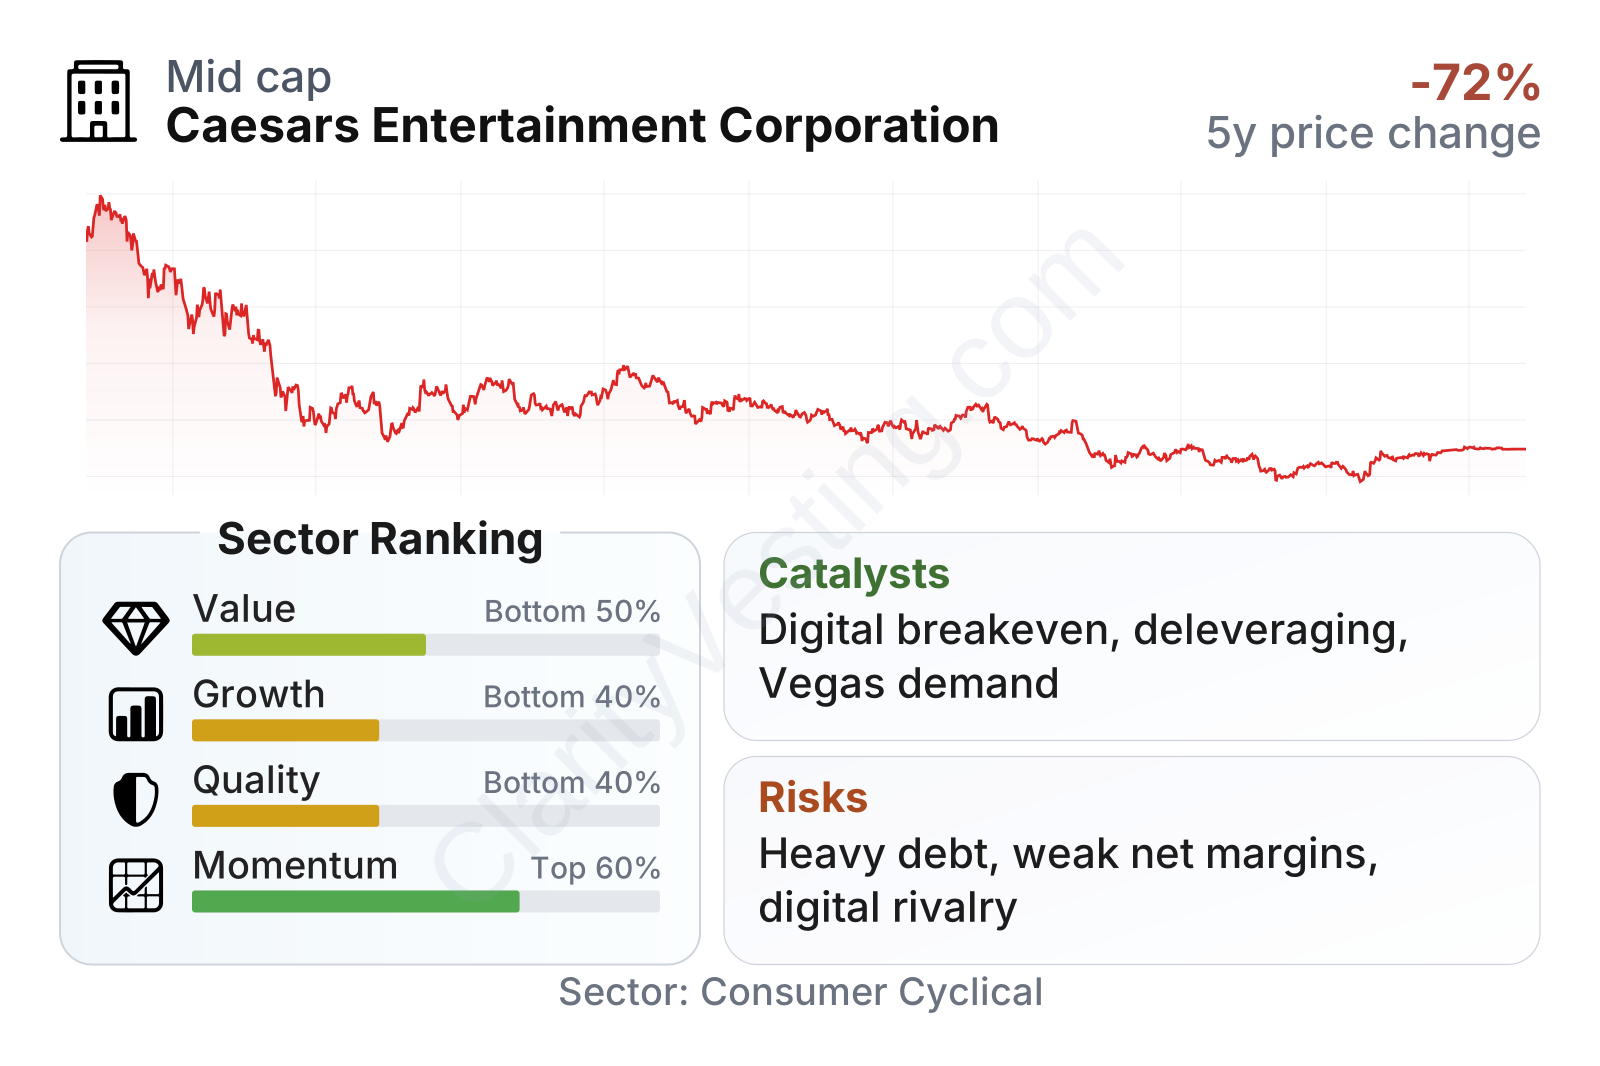
Caesars sits in the mid-sized range by market value and the stock has been much more volatile than the broader market, which fits the combination of consumer spending exposure, leverage, and digital betting expectations. The latest metrics show a mixed picture. On valuation measures tied to cash generation, the company looks better than many peers, helped by free cash flow yield around 10% and an EBIT-to-enterprise-value ratio slightly above the sector median. By contrast, growth and quality scores are weaker, mainly because revenue growth has slowed to about 3%, returns on invested capital are below the sector median, and leverage remains far above most peers. Operating margins are relatively strong, but those operating gains have not consistently turned into bottom-line profits.
Growth
The broader gaming and betting market still has room to expand over time. Regional casinos remain tied to consumer spending and travel activity, while online sports betting and iGaming continue to open up state by state in the U.S. That gives Caesars exposure to two different growth tracks: stable cash generation from established properties and potentially faster expansion from digital wagering.
Its strategy is coherent on paper. Caesars uses its well-known brands, national casino footprint, and Caesars Rewards database to cross-sell customers between physical properties and digital products. This can lower customer acquisition costs compared with digital-only operators, at least in theory. The company has also continued to focus on cost controls, property optimization, and spending discipline after the Eldorado-Caesars merger period.
Revenue growth has clearly cooled from the post-pandemic rebound. After very strong recovery years, the more recent pattern has been low single-digit expansion, with some quarters dipping slightly negative before turning positive again. That suggests Caesars is now in a more mature phase where growth depends less on reopening momentum and more on market share gains, pricing, digital execution, and new demand drivers.
Free cash flow is an important part of the long-term case because it shows the company can still generate meaningful cash even when accounting earnings are uneven. The recent rebound from a weak 2025 level toward roughly half a billion dollars on a trailing basis is encouraging. If that cash generation becomes more consistent, it could support debt reduction, technology investment, and better resilience in a softer economy.
A major catalyst is Caesars Digital. The digital segment has been moving closer to profitability after years of industry-wide heavy promotional spending. If management can keep improving digital margins while preserving market share, this part of the business could become more valuable than its current contribution to revenue suggests. Another growth support comes from Las Vegas convention demand, large events, and continued reinvestment in flagship properties, which can lift room rates and non-gaming spending.
Recent company updates have also pointed to a continuing focus on capital allocation, operational efficiencies, and the use of the loyalty platform to drive repeat visits. For a business with mature physical assets, execution in these areas matters more than simple unit expansion.
Risks
This article is for informational purposes only and does not constitute financial advice. Some content is AI-generated. See Disclaimer


