Stock Analysis · Clearwater Analytics Holdings Inc (CWAN)
Overview
Clearwater Analytics Holdings Inc. provides cloud-based software used by institutional investors to manage investment accounting, reporting, reconciliation, compliance, and analytics. In simple terms, its platform helps insurers, asset managers, corporations, and government-related entities keep track of large investment portfolios and produce the records and reports they need. The service is delivered through software-as-a-service, which means clients generally pay recurring fees to use the platform rather than buying software once and installing it themselves.
The business model is attractive for long-term analysis because much of its work is tied to ongoing portfolio administration. Investment accounting is not a one-time task; it is continuous, regulated, and operationally critical. That tends to support recurring revenue, sticky customer relationships, and long implementation cycles that can make switching providers inconvenient.
Based on company filings, Clearwater’s revenue is mainly generated from subscription and related services tied to its software platform, with additional revenue from implementation, support, and newer capabilities added through acquisitions. Public filings do not always break every category into exact percentages in a simple retail-friendly way, but the broad mix can be described as follows:
- Platform subscription and recurring service revenue: the large majority of revenue, likely above 80%. This includes ongoing access to Clearwater’s core investment accounting and reporting platform.
- Professional services and implementation: a smaller share, likely in the low-to-mid teens as a percentage of revenue. This covers onboarding, configuration, and client setup work.
- Other solutions and acquired capabilities: a growing but still smaller contribution. This includes adjacent products in areas such as risk, performance, and alternative asset support where available through internal development and acquisitions.
One notable financial pattern is that revenue has expanded much faster than operating expenses over the long run at the gross profit level, but heavy spending on research, product expansion, and administration has kept accounting profits under pressure. At the same time, gross profit has remained strong, which is typical of a software platform with recurring contracts.
Revenue and gross profit have climbed sharply over the last several years, showing that the core platform is scaling. The weaker point is that operating costs, especially research and development plus administrative spending, have also risen materially, which explains why strong top-line growth has not yet translated into consistently positive earnings.
Key Figures
| Metric | Value | Sector ⓘ |
|---|---|---|
| Date | Sep 12, 2026 | |
| Context | ||
| Sector | Technology | |
| Industry | Software - Application | |
| Market Cap ⓘ | $7.33B | |
| Beta ⓘ | 0.60 | |
Value (Cheapness) | ||
| P/E Ratio ⓘ | N/A | 29.51 |
| FCF Yield ⓘ | 2.08% | 4.25% |
| EBIT / EV ⓘ | -0.05% | 2.85% |
| PEG ⓘ | 1.78 | |
Growth (Business expansion) | ||
| Revenue Growth ⓘ | 74.40% | 15.40% |
| RPS Growth (5Y CAGR) ⓘ | 17.47% | 8.56% |
| EPS Growth (5Y CAGR) ⓘ | -9.86% | -11.88% |
| Margin Growth (5Y Trend) ⓘ | N/A | 0.46% |
| FCF Growth (5Y CAGR) ⓘ | N/A | 9.80% |
Quality (Business durability) | ||
| ROIC (Latest) ⓘ | -0.12% | 9.44% |
| ROIC (5Y Median) ⓘ | -1.46% | 8.30% |
| Net Debt / EBIT (Latest) ⓘ | N/A | 0.54 |
| Net Debt / EBIT (5Y Median) ⓘ | N/A | 0.44 |
| Operating Margin (Latest) ⓘ | -0.53% | 9.58% |
| Operating Margin (5Y Median) ⓘ | -1.76% | 8.25% |
| Debt to Equity (Latest) ⓘ | 42.00% | 33.33% |
| Profit Margin (Latest) ⓘ | -5.82% | 7.14% |
| Free Cash Flow (Latest) ⓘ | $152.49M | |
Momentum (Price trend) | ||
| 3Y Return ⓘ | +55.64% | +45.48% |
| 12M Return (excl. last month) ⓘ | +6.84% | +23.48% |
| 6M Return ⓘ | +1.82% | +20.93% |
| Price vs. 200-Day MA ⓘ | +9.59% | +7.43% |
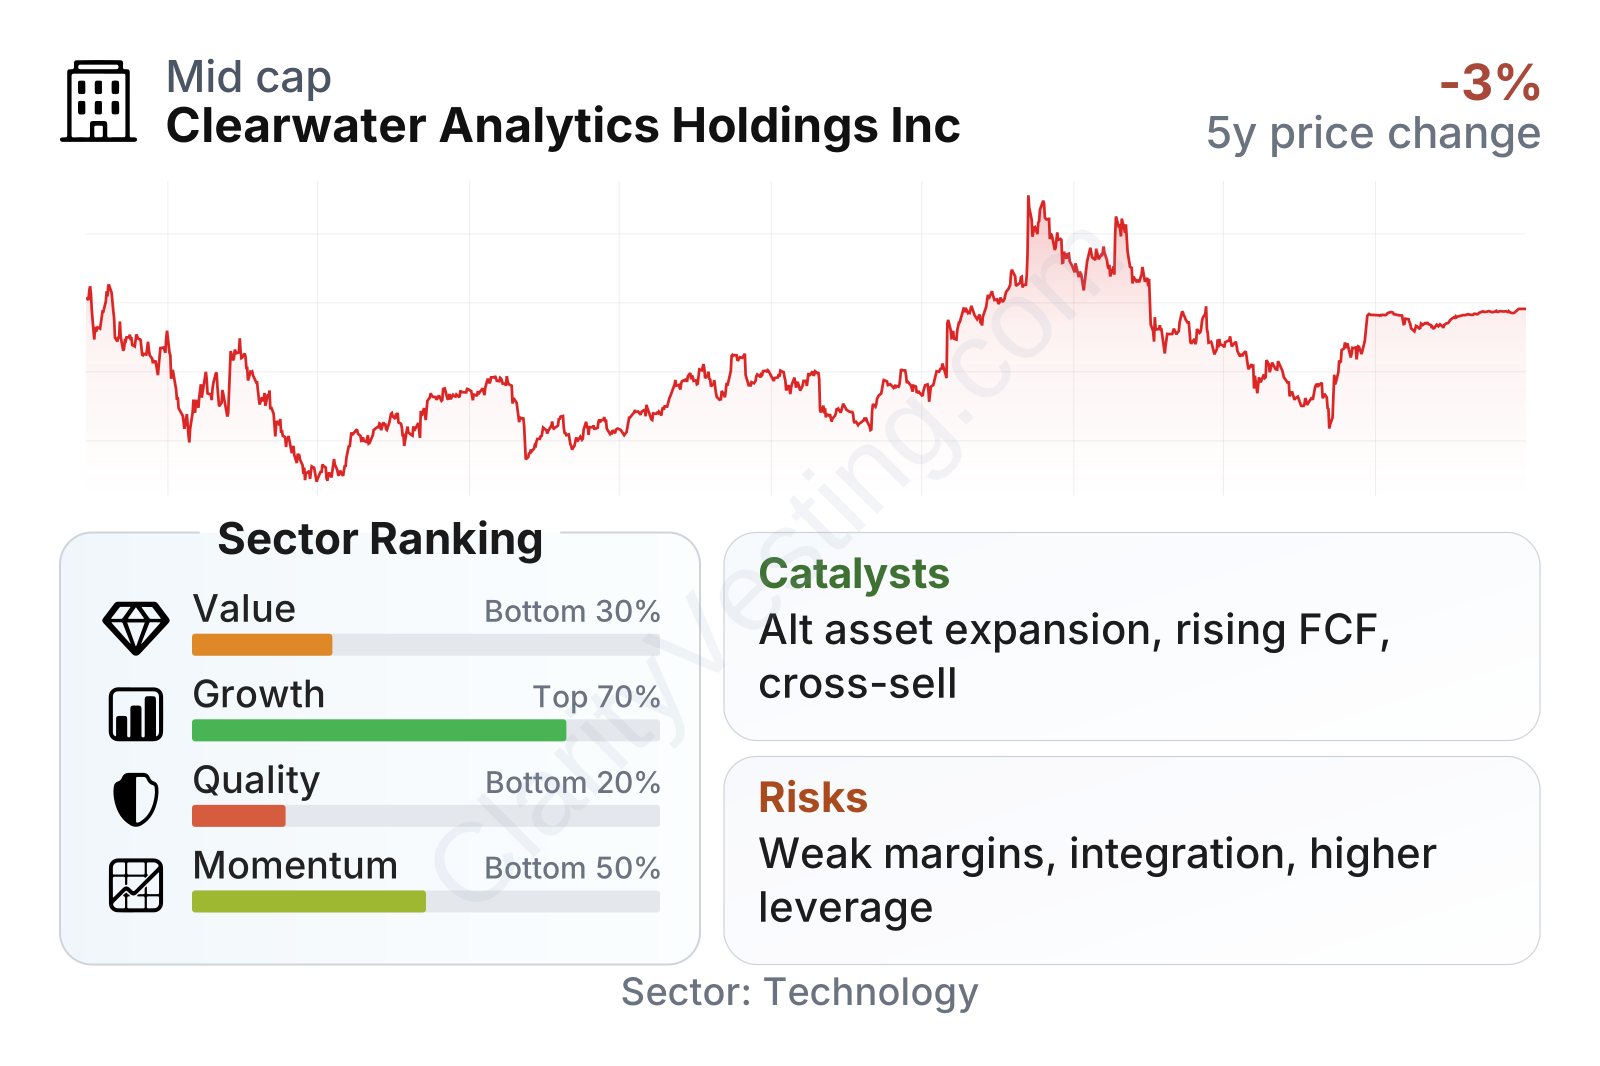
Clearwater is a mid-sized software company with a relatively low beta of about 0.60, which suggests the stock has historically moved less than the broader market. The most striking strength in the current profile is growth: year-over-year revenue growth is far above the sector median, and five-year revenue-per-share growth is also clearly ahead of many software peers. The weaker areas are quality and value. Profitability remains below sector norms, return on invested capital is still negative, and cash flow yield is modest relative to the broader software group. Price momentum has also cooled compared with the sector even though the longer three-year share performance remains ahead of the median.
Growth
Clearwater operates in a part of software that benefits from several durable industry trends. Financial institutions and large asset owners continue to shift away from manual spreadsheets, fragmented internal systems, and legacy on-premise tools. Regulatory complexity, rising reporting requirements, and the need for near-real-time portfolio visibility all support demand for modern cloud-based investment operations software. That makes the sector structurally favorable, even if spending cycles can still fluctuate.
The company’s strategy also appears logically aligned with that opportunity. Clearwater has been expanding from core investment accounting into a broader operating platform for institutional portfolios. That matters because clients often prefer fewer systems and fewer data handoffs across accounting, performance, compliance, and risk functions. A broader product set can increase revenue per client and deepen switching costs.
Growth has clearly accelerated. For several years, Clearwater was already posting revenue increases around the high teens to high twenties in percentage terms, which is strong for enterprise software. More recently, growth moved sharply higher into the 70%+ range, indicating a step change rather than just steady organic expansion. That kind of jump usually reflects a combination of healthy demand and the impact of acquisitions.
Cash generation is another constructive sign. Free cash flow has risen from a relatively modest level a few years ago to more than $150 million on a trailing basis. This is important because it shows the platform can produce real cash even while reported earnings remain pressured by amortization, stock-based compensation, acquisition-related items, or elevated operating investment. For a software company still broadening its footprint, improving cash flow often matters more than short-term net income volatility.
Recent company updates point to a meaningful growth catalyst in Clearwater’s push into adjacent markets such as alternative assets and broader front-to-back investment operations. Acquisitions and product expansion can make the platform more valuable to existing clients while opening access to larger institutions that need more than traditional fixed-income accounting. If integration goes well, that could expand the company’s addressable market materially.
Another favorable element is the client base itself. Clearwater serves institutions such as insurers and asset owners that often run large, complex portfolios and have strict reporting requirements. Once embedded, these relationships can be durable. That does not guarantee rapid growth every year, but it can support a longer runway for recurring revenue expansion.
Risks
This article is for informational purposes only and does not constitute financial advice. Some content is AI-generated. See Disclaimer


