Stock Analysis · CTS Corporation (CTS)
Overview
CTS Corporation is a mid-sized electronic components manufacturer focused on parts that help larger systems sense, connect, filter, and operate reliably. Its products are used in vehicles, industrial equipment, aerospace and defense applications, medical devices, information technology hardware, and communications infrastructure. In simple terms, CTS makes specialized components that usually represent a small portion of the end product’s cost, but can still matter a lot for performance, durability, and safety.
The company reports one operating segment, but its end-market mix gives a clearer picture of where revenue comes from. Based on recent annual reporting, the largest source is transportation, especially automotive programs such as sensors, actuators, and related electronic components. The rest comes from a mix of industrial, aerospace and defense, medical, and information technology and communications uses. Approximate revenue exposure is as follows:
- Transportation: about 56% of revenue. This includes components used in passenger vehicles and other transportation applications, with meaningful exposure to sensing and electronic control systems.
- Industrial: about 20% of revenue. This covers equipment, controls, and other industrial electronics applications.
- Aerospace & defense: about 10% of revenue. These programs tend to have longer qualification cycles and stricter reliability requirements.
- Medical: about 8% of revenue. This area includes components for devices where precision and consistency are important.
- Information technology & communications: about 6% of revenue. This includes electronics used in networking, communications, and computing-related systems.
Geographically, CTS is also fairly international, with sales spread across North America, Asia, and Europe. That helps diversify demand, but it also means results are influenced by global manufacturing activity and customer production schedules.
The business model is not built around consumer brands. Instead, CTS competes through engineering, customer relationships, manufacturing know-how, and the ability to meet demanding reliability standards. That can make revenue steadier once a part is designed into a customer’s product, although volumes can still move with industrial and automotive cycles.
Over the last several years, revenue has moved in cycles, but profitability has improved meaningfully from the loss seen in 2021. Gross profit has held up relatively well even when sales softened, and operating income recovered strongly by 2025. That points to a business that has become more efficient and more disciplined on costs.
Key Figures
| Metric | Value | Sector ⓘ |
|---|---|---|
| Date | Sep 12, 2026 | |
| Context | ||
| Sector | Technology | |
| Industry | Electronic Components | |
| Market Cap ⓘ | $1.65B | |
| Beta ⓘ | 1.03 | |
Value (Cheapness) | ||
| P/E Ratio ⓘ | 23.52 | 29.51 |
| FCF Yield ⓘ | 5.53% | 4.25% |
| EBIT / EV ⓘ | 6.09% | 2.85% |
| PEG ⓘ | 1.18 | |
Growth (Business expansion) | ||
| Revenue Growth ⓘ | 7.00% | 15.40% |
| RPS Growth (5Y CAGR) ⓘ | 3.47% | 8.56% |
| EPS Growth (5Y CAGR) ⓘ | -15.69% | -11.88% |
| Margin Growth (5Y Trend) ⓘ | 28.07% | 0.46% |
| FCF Growth (5Y CAGR) ⓘ | 5.21% | 9.80% |
Quality (Business durability) | ||
| ROIC (Latest) ⓘ | 11.69% | 9.44% |
| ROIC (5Y Median) ⓘ | 10.36% | 8.30% |
| Net Debt / EBIT (Latest) ⓘ | 0.08 | 0.54 |
| Net Debt / EBIT (5Y Median) ⓘ | -0.14 | 0.44 |
| Operating Margin (Latest) ⓘ | 17.13% | 9.58% |
| Operating Margin (5Y Median) ⓘ | 14.22% | 8.25% |
| Debt to Equity (Latest) ⓘ | 20.19% | 33.33% |
| Profit Margin (Latest) ⓘ | 12.37% | 7.14% |
| Free Cash Flow (Latest) ⓘ | $91.41M | |
Momentum (Price trend) | ||
| 3Y Return ⓘ | +40.81% | +45.48% |
| 12M Return (excl. last month) ⓘ | +54.18% | +23.48% |
| 6M Return ⓘ | +23.84% | +20.93% |
| Price vs. 200-Day MA ⓘ | +5.31% | +7.43% |
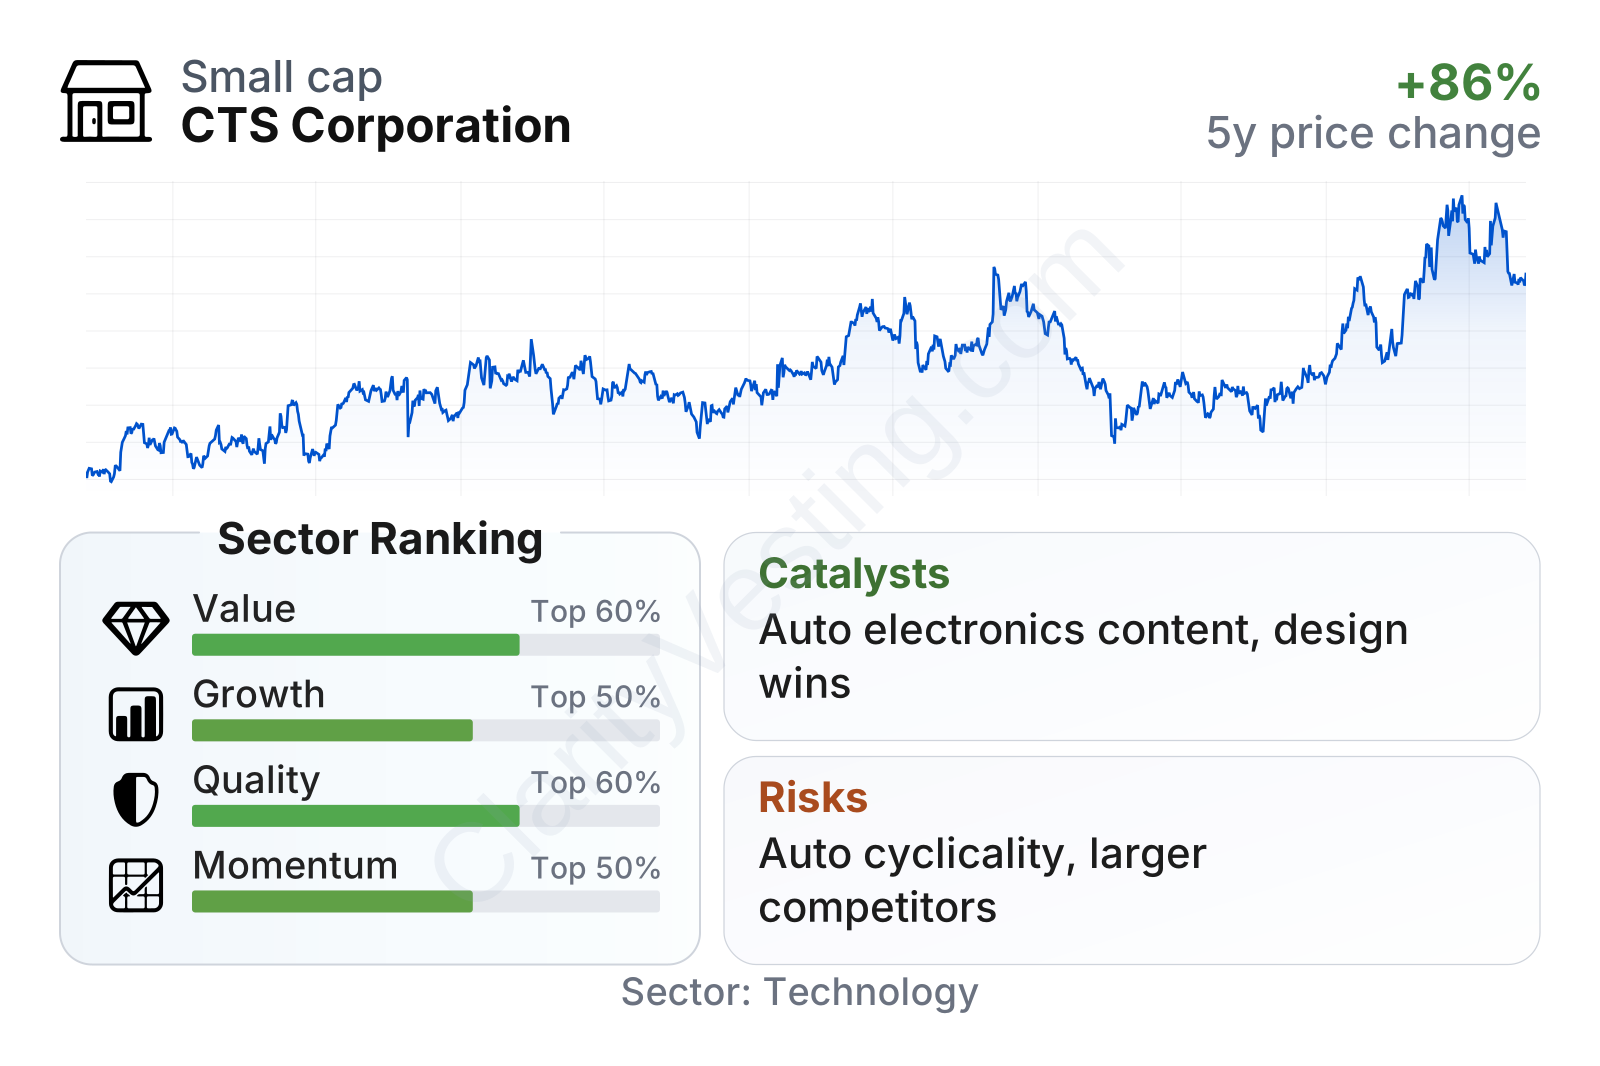
CTS sits in the smaller public-company range within the technology sector, with share price volatility close to the market average. The overall profile is balanced: valuation is around the better half of the sector, quality is supported by solid returns on invested capital and modest leverage, and momentum has recently been stronger than many peers. Growth metrics are more mixed, with recent improvement but a longer-term growth pace that still trails many technology names.
Margins stand out positively. Operating margin is around the high teens and profit margin is roughly 12%, both comfortably above sector medians. Debt is also moderate, with debt-to-equity near 20% and net debt very low relative to earnings. That combination gives CTS a more resilient financial profile than many component makers that operate with thinner margins or heavier balance-sheet risk.
Growth
CTS operates in markets that have credible long-term demand drivers, even if they are not fast-growing every single year. Automotive electronics content continues to rise as vehicles add more sensing, control, connectivity, and electrification features. Industrial equipment is also becoming more electronic and more connected. In aerospace, defense, and medical, customers usually prioritize reliability and long product life, which can support repeat business and higher-value applications.
The company’s strategy broadly fits these trends. CTS has emphasized higher-value components rather than commodity-style electronics, with a focus on sensing, connectivity, and engineered parts that can be designed into customer platforms. That matters because design wins can create multi-year revenue streams once production begins. The strategy also benefits from a diversified end-market mix: automotive is the largest exposure, but not the only one.
Revenue growth has been uneven over the last few years. After a strong expansion phase in 2022, the company went through a downturn in 2023 and much of 2024, then returned to positive year-over-year growth through 2025 and into 2026. Most recently, growth has been running in the mid-single-digit to low-double-digit range. That does not look like a hyper-growth profile, but it does suggest that the business has regained momentum after a cyclical pause.
Cash generation has remained healthy through that period. Free cash flow has generally stayed in the tens of millions of dollars and recovered again into 2026 after softer levels in 2024 and 2025. For a component manufacturer, that is important because it shows the company is converting earnings into cash rather than relying heavily on borrowing or accounting gains.
A meaningful catalyst is the broader increase in electronic content per vehicle and per industrial system. Even when unit production grows slowly, suppliers can still expand if their content per product rises. CTS also has room to benefit from program wins in higher-specification markets such as aerospace, defense, and medical, where qualification barriers are higher and pricing is often less commoditized than in standard consumer electronics.
Recent company updates have also pointed to continued portfolio shaping and operating discipline rather than chasing volume at any cost. That may not produce dramatic top-line acceleration, but it can support a better mix of business and more durable margins over time.
Risks
This article is for informational purposes only and does not constitute financial advice. Some content is AI-generated. See Disclaimer


