Stock Analysis · Carsales.Com Ltd (CSXXY)
Overview
Carsales.com Ltd is an online automotive marketplace company best known for operating digital platforms where consumers and dealers can list, search, compare, and buy or sell vehicles. What began in Australia has expanded into a broader portfolio of automotive classifieds, dealer software, data services, media products, and international marketplace investments. In simple terms, the company makes money by helping vehicle sellers reach buyers efficiently, while also selling related tools and services to dealerships and auto industry participants.
The business is still anchored in Australia, where the carsales brand is one of the most recognized names in online vehicle listings. Over time, the company has widened its exposure through businesses in Latin America, Asia, and North America. This matters for long-term analysis because Carsales.com is no longer just a single-country classifieds website; it is increasingly a collection of automotive digital platforms with recurring advertising, subscription, and service income.
Based on company reporting, revenue is mainly generated from the following areas:
- Australian online classifieds and dealer services: the largest contributor, likely around 50% to 60% of group revenue. This includes listing fees, dealer subscriptions, display advertising, lead generation, and related products sold through the domestic marketplace.
- International marketplaces and investments: roughly 30% to 40%. This includes major interests in overseas automotive platforms, especially in Latin America and other growth markets, where Carsales.com participates in marketplace economics outside Australia.
- Data, software, media, and adjacent automotive services: roughly 10% to 15%. This includes valuation data, dealer tools, finance or transaction-related services, and other supporting digital products tied to the vehicle ecosystem.
The overall financial structure shows a business with very high gross profitability, which is typical of digital marketplace models. Revenue has increased strongly over the last several years, while operating profit and cash generation have remained solid despite some fluctuations in accounting earnings tied to financing costs and portfolio effects.
The broad picture is that Carsales.com keeps a large share of its revenue after direct costs, reflecting the attractive economics of online platforms. Costs have risen as the business expanded internationally, but the model still converts a meaningful portion of revenue into operating profit and cash flow.
Key Figures
| Metric | Value | Sector ⓘ |
|---|---|---|
| Date | Sep 12, 2026 | |
| Context | ||
| Sector | Communication Services | |
| Industry | Internet Content & Information | |
| Market Cap ⓘ | $7.48B | |
| Beta ⓘ | 0.80 | |
Value (Cheapness) | ||
| P/E Ratio ⓘ | 32.87 | 18.61 |
| FCF Yield ⓘ | 13.35% | 13.68% |
| EBIT / EV ⓘ | N/A | 4.54% |
| PEG ⓘ | 2.90 | |
Growth (Business expansion) | ||
| Revenue Growth ⓘ | 3.80% | 5.40% |
| RPS Growth (5Y CAGR) ⓘ | 16.05% | 4.62% |
| EPS Growth (5Y CAGR) ⓘ | 10.19% | -18.01% |
| Margin Growth (5Y Trend) ⓘ | -8.62% | 1.10% |
| FCF Growth (5Y CAGR) ⓘ | 33.09% | 5.88% |
Quality (Business durability) | ||
| ROIC (Latest) ⓘ | N/A | 8.38% |
| ROIC (5Y Median) ⓘ | 10.84% | 8.32% |
| Net Debt / EBIT (Latest) ⓘ | 1.34 | 1.99 |
| Net Debt / EBIT (5Y Median) ⓘ | 2.46 | 2.94 |
| Operating Margin (Latest) ⓘ | 39.05% | 14.89% |
| Operating Margin (5Y Median) ⓘ | 38.97% | 12.96% |
| Debt to Equity (Latest) ⓘ | 58.40% | 59.59% |
| Profit Margin (Latest) ⓘ | 25.03% | 8.77% |
| Free Cash Flow (Latest) ⓘ | $997.79M | |
Momentum (Price trend) | ||
| 3Y Return ⓘ | +11.67% | +46.64% |
| 12M Return (excl. last month) ⓘ | -15.38% | +2.16% |
| 6M Return ⓘ | +9.29% | +5.05% |
| Price vs. 200-Day MA ⓘ | +0.65% | +2.88% |
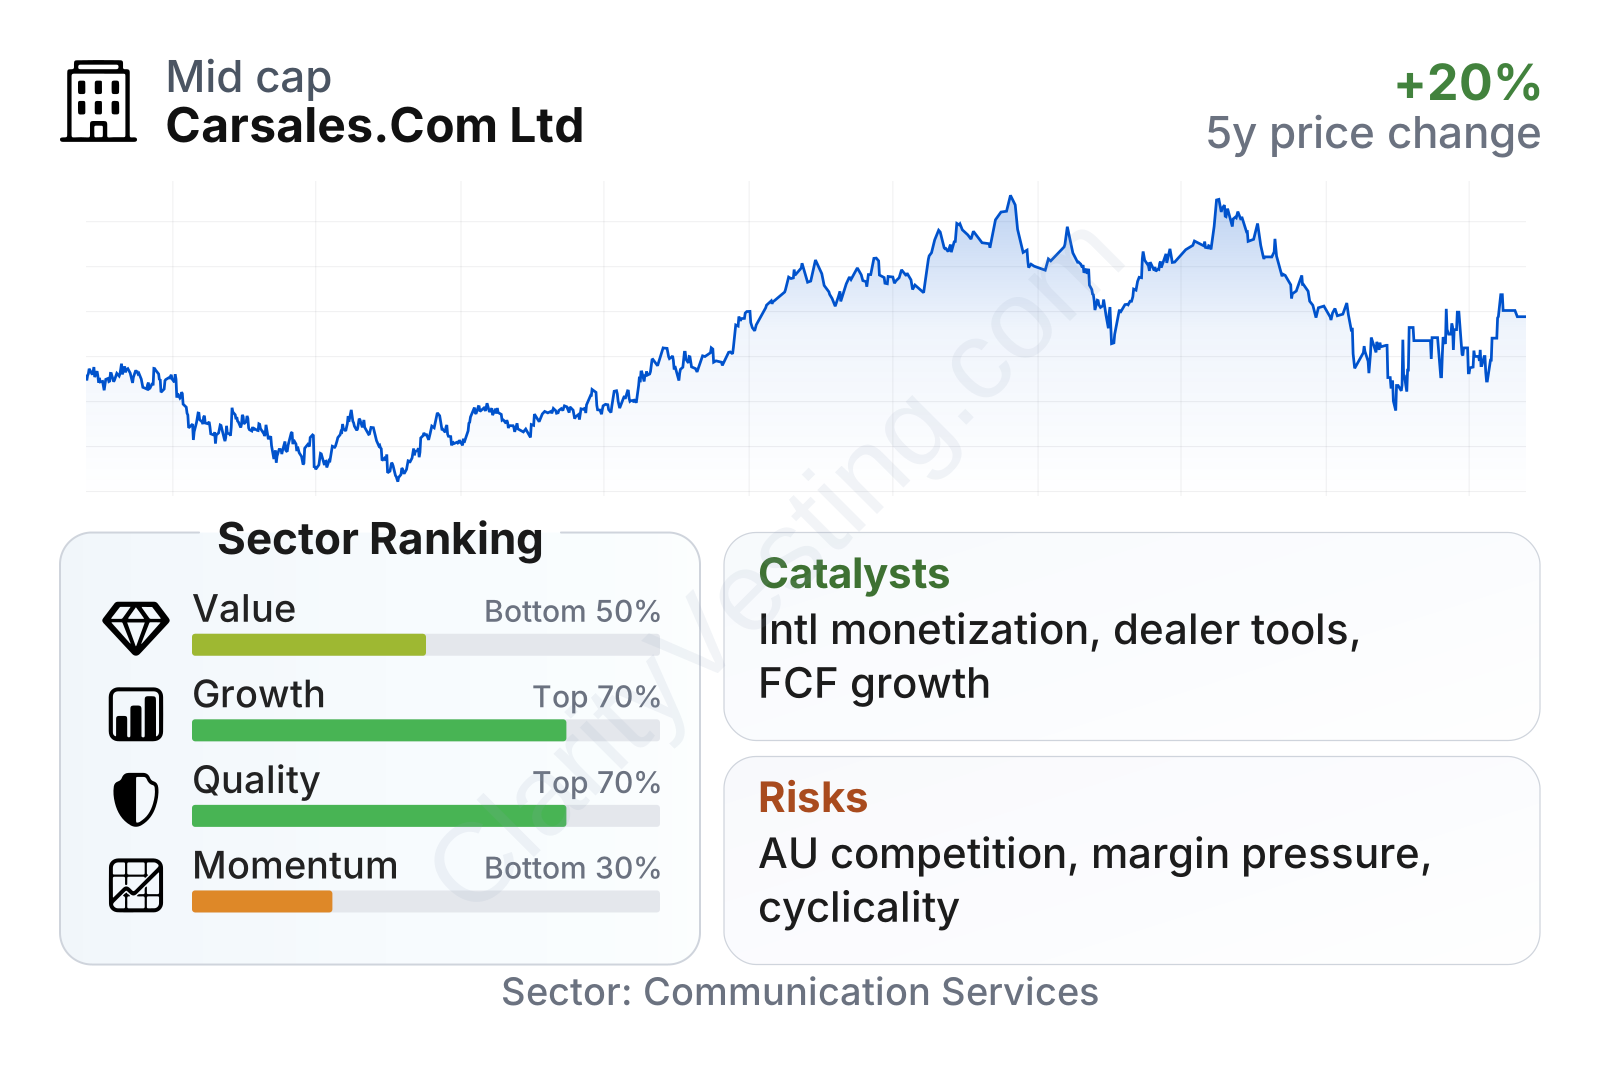
Carsales.com is a large, established digital platform company with relatively low share-price volatility, reflected in a beta below 1. On valuation, it screens as less attractive than many sector peers, mainly because its earnings multiple is above the sector median. On the other hand, profitability and cash generation are notably strong: operating margin is far above the sector norm, profit margin is also well ahead of peers, and leverage looks manageable. Growth is mixed in the short term, with recent revenue expansion below the sector median, but the longer record is much better, especially for revenue per share, earnings, and free cash flow. Share-price momentum has been weaker than the sector over longer periods, which helps explain why the market is not assigning an even richer premium.
Growth
Carsales.com operates in a sector with durable long-term tailwinds. Vehicle buying and selling continues to move online, dealers increasingly rely on digital lead generation, and automotive advertising has steadily migrated from print and offline channels to marketplace platforms. These trends support companies that already have scale, trusted brands, and deep inventory. Carsales.com fits that profile, especially in Australia, where network effects matter: buyers go where listings are abundant, and sellers prefer platforms where buyers already are.
The company’s strategy also makes sense from a long-term perspective. Instead of relying only on the mature Australian market, it has built a broader geographic portfolio and added adjacent services around data, software, and dealer tools. That diversification can reduce dependence on one single market and opens room for further monetization beyond listing fees alone. It also strengthens the platform by embedding the company more deeply into dealership workflows.
Recent yearly revenue growth appears positive but not especially fast by sector standards, coming in around the mid-single-digit range. That can look modest for an internet business, but the longer view is stronger: over five years, revenue per share growth has clearly outpaced the typical company in the sector. This suggests Carsales.com has not been a hypergrowth name recently, but it has compounded steadily over time.
Cash generation is one of the more compelling parts of the growth profile. Free cash flow has expanded sharply over recent years, and the five-year compounded growth rate is far ahead of the sector median. For a digital marketplace, this is important because it shows that growth is not only accounting-based; it is also translating into real cash that can support acquisitions, debt reduction, platform investment, or shareholder distributions.
A meaningful catalyst is continued monetization of international assets. Carsales.com has exposure to automotive platforms in markets where online classifieds penetration and dealer digitization may still have room to deepen. If those operations improve pricing, inventory depth, or service attachment rates, group growth could become broader than Australia alone. Another positive driver is the company’s ability to layer new products onto an existing audience, such as data services, software tools, and transaction-related offerings, which can increase revenue per user without needing the same pace of audience growth.
Recent company communications have also continued to emphasize platform investment, dealer product development, and international execution rather than a dramatic strategic reset. That usually signals continuity: the growth plan is based on strengthening proven marketplace positions and extracting more value from them over time.
Risks
This article is for informational purposes only and does not constitute financial advice. Some content is AI-generated. See Disclaimer


