Stock Analysis · Celestica Inc (CLS)
Overview
Celestica Inc is a Canadian technology manufacturing and supply chain company. In simple terms, it helps other businesses design, build, and deliver complex electronic products. Its customers are mostly large companies rather than consumers, and Celestica sits behind the scenes in markets such as communications equipment, enterprise hardware, aerospace and defense, industrial systems, and data center infrastructure.
The business is organized around two main segments. The larger one is Advanced Technology Solutions, which has become the main growth engine as demand has increased for data center hardware, networking equipment, and specialized industrial and aerospace products. The second is Connectivity & Cloud Solutions, which includes communications and enterprise-related programs and provides large-scale manufacturing, integration, and supply chain services.
Based on the company’s recent filings, revenue is primarily generated from the following sources:
- Advanced Technology Solutions: about 70% of revenue. This includes servers, storage and networking platforms for data centers, aerospace and defense products, industrial equipment, health technology, and other specialized programs where engineering and reliability matter.
- Connectivity & Cloud Solutions: about 30% of revenue. This includes communications equipment, enterprise hardware, and cloud-related manufacturing and supply chain services for large customers.
That mix matters because the higher-value areas of the portfolio have been expanding faster than the more traditional contract manufacturing activities. Over the last several years, revenue has grown strongly, but profit has improved even faster, which suggests the company is not only selling more units but also moving toward better economics.
The flow of revenue and earnings also shows a useful pattern: sales have increased from roughly $5.6 billion in 2021 to about $12.6 billion in 2025, while net income has risen from about $104 million to roughly $847 million over the same period. That is a major jump in scale and profitability, and it helps explain why the market has re-rated the stock so sharply.
Key Figures
| Metric | Value | Sector ⓘ |
|---|---|---|
| Date | Sep 12, 2026 | |
| Context | ||
| Sector | Technology | |
| Industry | Electronic Components | |
| Market Cap ⓘ | $43.70B | |
| Beta ⓘ | 1.46 | |
Value (Cheapness) | ||
| P/E Ratio ⓘ | 35.99 | 29.51 |
| FCF Yield ⓘ | 1.19% | 4.25% |
| EBIT / EV ⓘ | 3.04% | 2.85% |
| PEG ⓘ | 1.00 | |
Growth (Business expansion) | ||
| Revenue Growth ⓘ | 62.40% | 15.40% |
| RPS Growth (5Y CAGR) ⓘ | 24.98% | 8.56% |
| EPS Growth (5Y CAGR) ⓘ | 47.30% | -11.88% |
| Margin Growth (5Y Trend) ⓘ | 5.39% | 0.46% |
| FCF Growth (5Y CAGR) ⓘ | 27.84% | 9.80% |
Quality (Business durability) | ||
| ROIC (Latest) ⓘ | 35.59% | 9.44% |
| ROIC (5Y Median) ⓘ | 12.71% | 8.30% |
| Net Debt / EBIT (Latest) ⓘ | 0.33 | 0.54 |
| Net Debt / EBIT (5Y Median) ⓘ | 1.07 | 0.44 |
| Operating Margin (Latest) ⓘ | 8.56% | 9.58% |
| Operating Margin (5Y Median) ⓘ | 4.83% | 8.25% |
| Debt to Equity (Latest) ⓘ | 32.68% | 33.33% |
| Profit Margin (Latest) ⓘ | 7.16% | 7.14% |
| Free Cash Flow (Latest) ⓘ | $519.94M | |
Momentum (Price trend) | ||
| 3Y Return ⓘ | +1334.99% | +45.48% |
| 12M Return (excl. last month) ⓘ | +59.03% | +23.48% |
| 6M Return ⓘ | +30.83% | +20.93% |
| Price vs. 200-Day MA ⓘ | +5.38% | +7.43% |
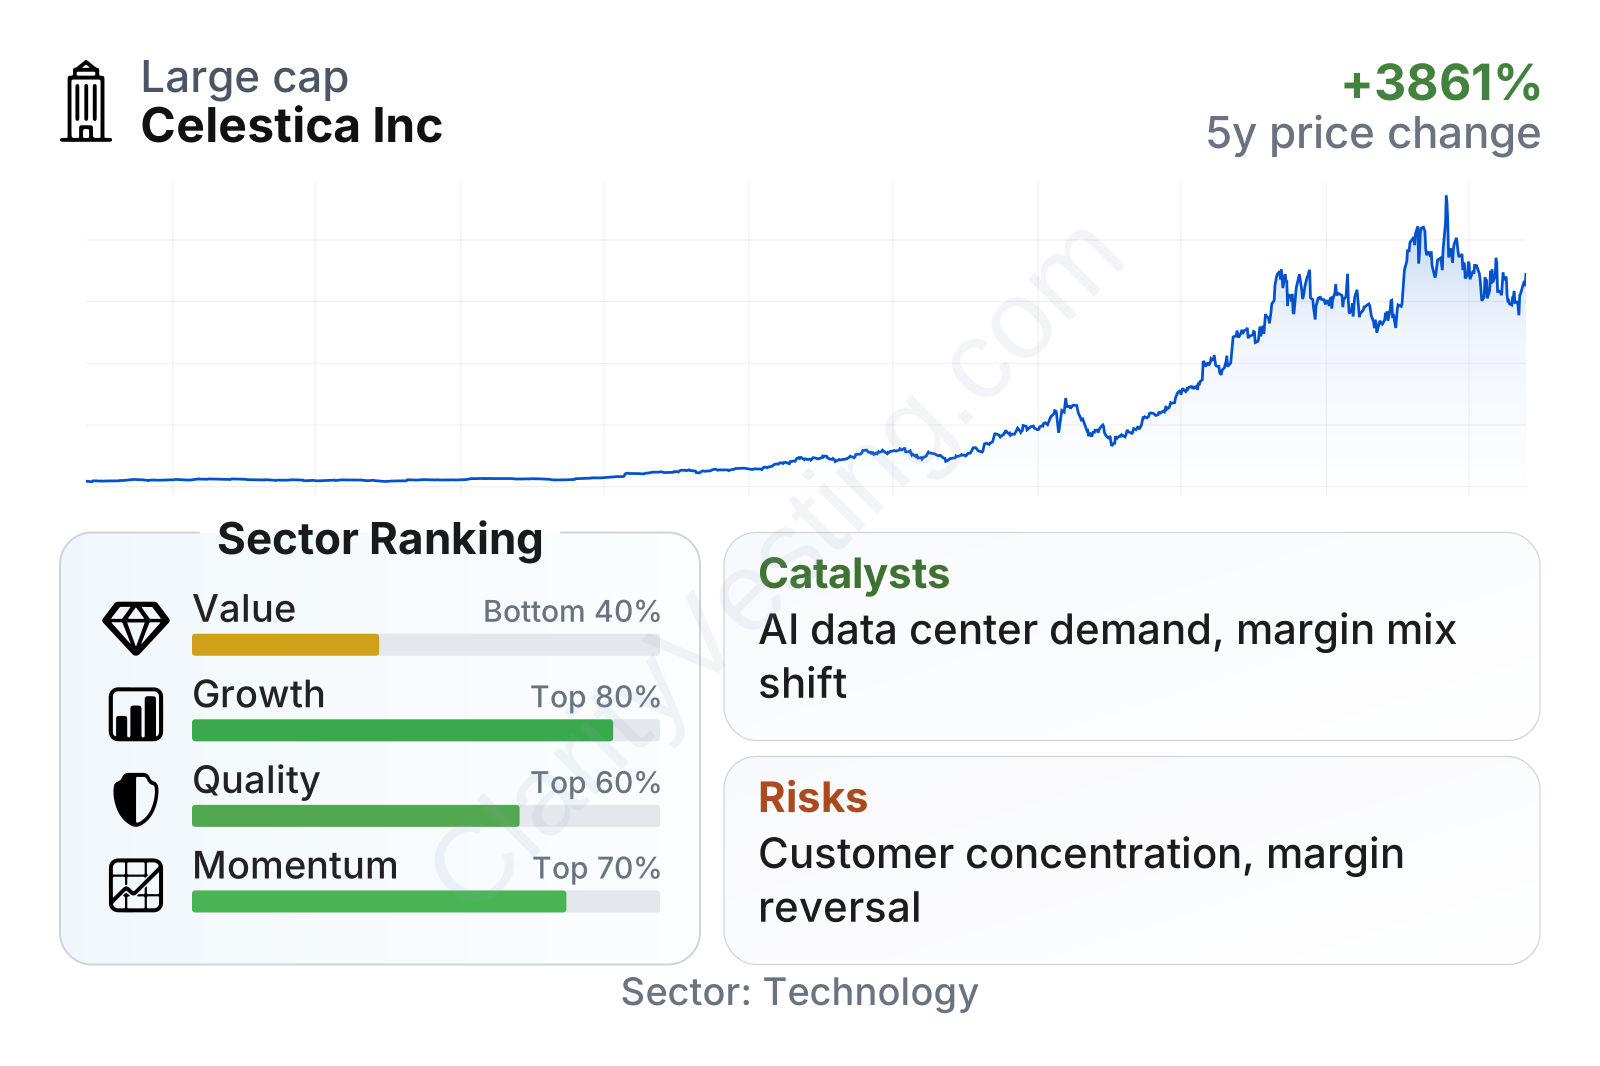
Celestica is now a large technology manufacturer by market value, but its recent market behavior has been much more aggressive than that of a typical mature industrial supplier. The stock’s long multi-year climb reflects a business that has shifted from modest margins and slower expectations to much faster growth and stronger returns on capital.
The metrics table points to a clear profile. Growth ranks well above much of the sector, with revenue, earnings, and cash flow expanding faster than the typical technology peer. Quality is also solid, especially on returns on invested capital and current debt load. Value is less appealing: the earnings multiple and free cash flow yield suggest the market is already recognizing much of the company’s operational progress.
Growth
Celestica operates in several markets, but the most important long-term tailwind is the buildout of digital infrastructure. Data centers, AI-related computing, networking upgrades, and more complex hardware systems all require the kind of manufacturing, integration, testing, and supply chain execution that Celestica provides. This is a favorable place to be because customers increasingly need both scale and technical know-how, not just low-cost assembly.
The company’s strategy appears coherent. Management has spent years pushing the business toward programs with better margins, deeper engineering content, and more durable customer relationships. That includes hyperscale and enterprise data center products, networking switches, aerospace and defense systems, and other specialized end markets. The result has been a business mix that looks stronger today than it did a few years ago.
Recent revenue growth has been exceptional, accelerating from already healthy levels to more than 60% year over year in the latest reading. That is far above the sector median and signals that Celestica is participating in a major spending cycle rather than relying on a small internal efficiency story. Its five-year revenue per share growth of roughly 25% annually also suggests this is not just a one-quarter spike.
Cash generation has also improved materially. Trailing free cash flow has climbed from roughly $150 million a few years ago to around $500 million recently. This is important because it shows that growth is converting into real cash, not just accounting earnings. A stronger cash profile gives the company more flexibility for capacity, technology investments, acquisitions, or balance-sheet management.
A notable catalyst is the company’s exposure to AI and high-performance computing infrastructure through its hardware platforms and networking-related offerings. Public company updates in 2026 have continued to emphasize demand tied to data center programs and the company’s ability to scale with large customers. If that demand remains strong, Celestica could continue benefiting from both higher volumes and a richer product mix.
Risks
This article is for informational purposes only and does not constitute financial advice. Some content is AI-generated. See Disclaimer


