Stock Analysis · Clear Channel Outdoor Holdings Inc (CCO)
Overview
Clear Channel Outdoor Holdings Inc is an out-of-home advertising company. In simple terms, it owns or operates advertising space placed in public environments such as billboards, street furniture, transit displays, and airport advertising. Brands, local businesses, and public institutions pay Clear Channel to display messages where people commute, shop, travel, and spend time outside their homes.
The business is built around selling advertising inventory across physical locations, with an increasing focus on digital screens that can rotate multiple ads and be updated quickly. That makes the company part of the broader advertising market, but with a distinct niche: real-world media assets tied to traffic patterns, urban locations, and transportation hubs.
Based on recent company reporting, revenue is mainly generated from the Americas segment, with airports adding a smaller but still meaningful share.
- America outdoor advertising: about 80% to 85% of revenue. This includes roadside billboards, digital billboards, street furniture, and transit-related displays across the U.S. and parts of Latin America.
- Airports: about 15% to 20% of revenue. This includes advertising displays inside airports, where brands pay for access to high-traffic traveler audiences.
Operationally, the business has shown a useful pattern: revenue recovered over recent years, operating income improved, and free cash flow turned positive more recently. At the same time, interest expense has stayed very large, which explains why stronger operations have not consistently translated into solid net profits.
Key Figures
| Metric | Value | Sector ⓘ |
|---|---|---|
| Date | Sep 12, 2026 | |
| Context | ||
| Sector | Communication Services | |
| Industry | Advertising Agencies | |
| Market Cap ⓘ | $1.21B | |
| Beta ⓘ | 1.96 | |
Value (Cheapness) | ||
| P/E Ratio ⓘ | N/A | 18.61 |
| FCF Yield ⓘ | 5.80% | 13.68% |
| EBIT / EV ⓘ | 1.03% | 4.54% |
| PEG ⓘ | 16.57 | |
Growth (Business expansion) | ||
| Revenue Growth ⓘ | 8.70% | 5.40% |
| RPS Growth (5Y CAGR) ⓘ | -3.91% | 4.62% |
| EPS Growth (5Y CAGR) ⓘ | -6.67% | -18.01% |
| Margin Growth (5Y Trend) ⓘ | 21.08% | 1.10% |
| FCF Growth (5Y CAGR) ⓘ | N/A | 5.88% |
Quality (Business durability) | ||
| ROIC (Latest) ⓘ | 2.17% | 8.38% |
| ROIC (5Y Median) ⓘ | 8.43% | 8.32% |
| Net Debt / EBIT (Latest) ⓘ | 0.08 | 1.99 |
| Net Debt / EBIT (5Y Median) ⓘ | 26.07 | 2.94 |
| Operating Margin (Latest) ⓘ | 4.60% | 14.89% |
| Operating Margin (5Y Median) ⓘ | 17.83% | 12.96% |
| Debt to Equity (Latest) ⓘ | -187.14% | 59.59% |
| Profit Margin (Latest) ⓘ | -6.31% | 8.77% |
| Free Cash Flow (Latest) ⓘ | $70.27M | |
Momentum (Price trend) | ||
| 3Y Return ⓘ | +67.61% | +46.64% |
| 12M Return (excl. last month) ⓘ | +117.12% | +2.16% |
| 6M Return ⓘ | +0.42% | +5.05% |
| Price vs. 200-Day MA ⓘ | +3.01% | +2.88% |
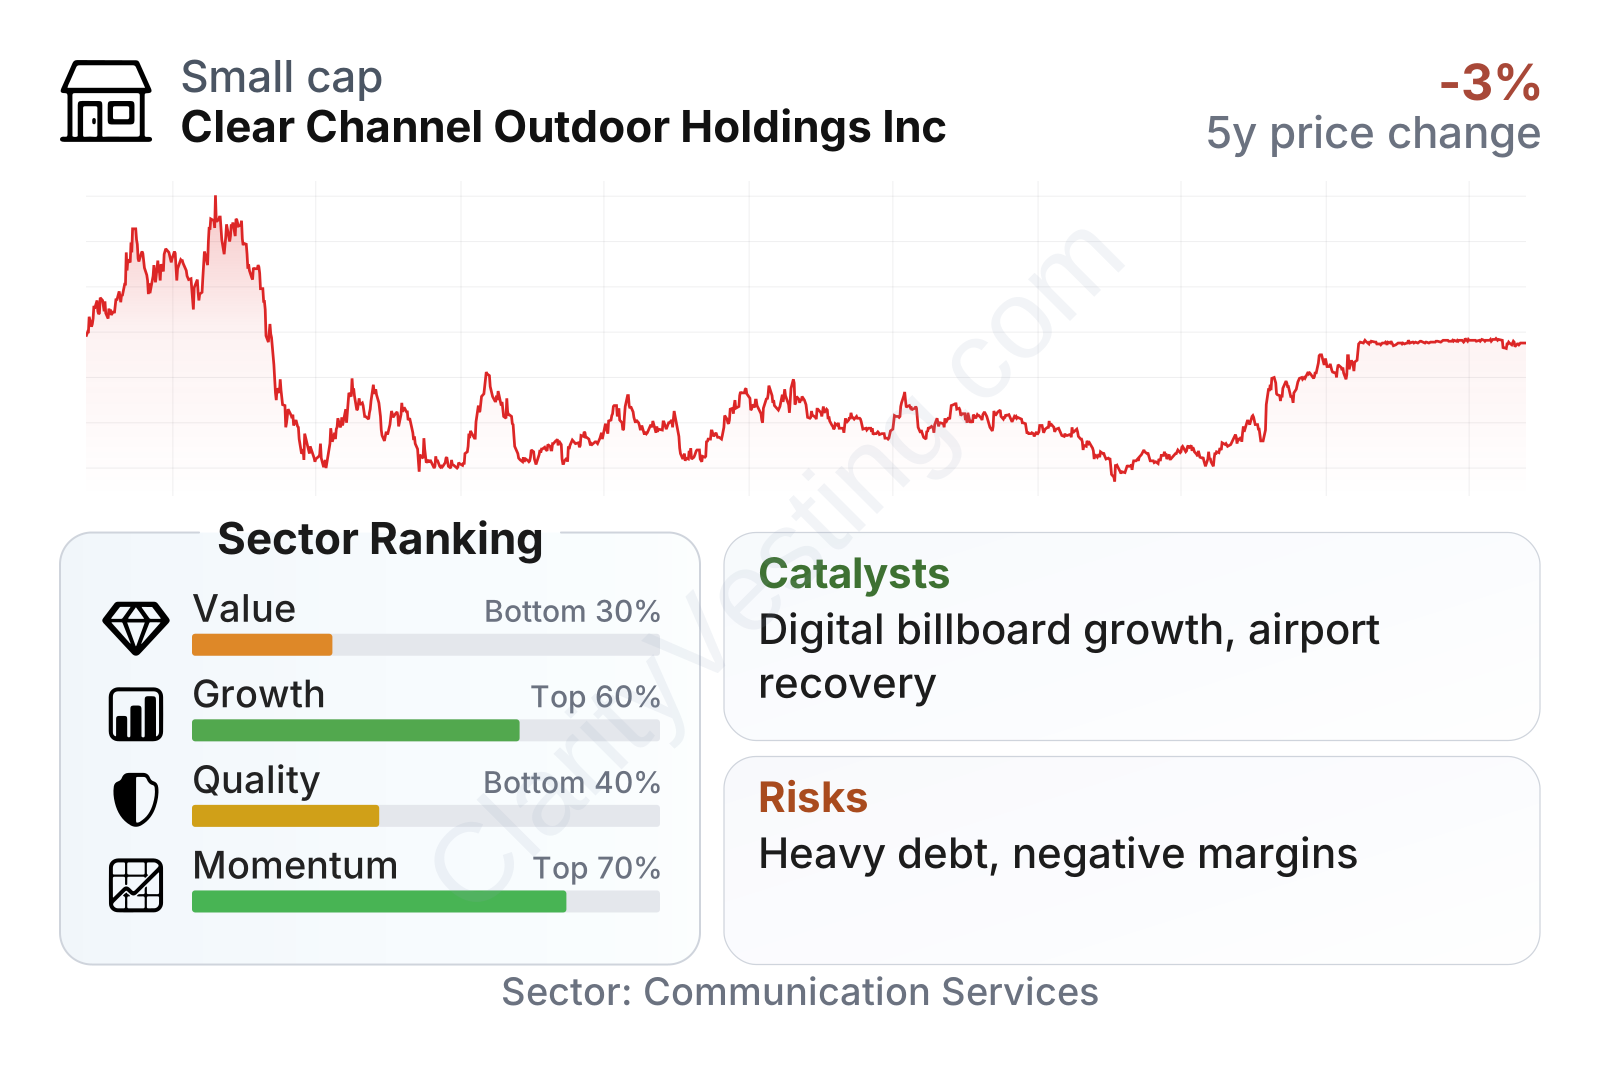
Clear Channel is a small-cap company with a stock that has been much more volatile than the market, as shown by its beta near 2. The factor snapshot is mixed. Growth and momentum rank better than value and quality, which fits a business that is improving operationally but still carries profitability and balance-sheet concerns. Recent revenue growth is running above the sector median, and share-price performance has been strong over the last year, but returns on capital and profit margins remain weaker than many peers.
The table also highlights an important contrast: free cash flow has improved and operating-margin trends over five years look constructive, yet current profitability is still below sector norms. That combination often points to a company in transition rather than one that has already reached a stable earnings profile.
Growth
Clear Channel operates in a sector that still has room to grow over the long run. Out-of-home advertising benefits from urban mobility, commuting, tourism, and the continued shift toward digital displays. Unlike traditional static advertising, digital billboards and screens can serve multiple customers on the same asset, support time-based campaigns, and react quickly to events or audience patterns. That improves the earning potential of each location.
The company’s strategy broadly makes sense for this environment. It has been emphasizing higher-yield digital inventory, disciplined cost management, and improvement in cash generation. Airport advertising can also be attractive because it gives access to premium audiences and often benefits when travel activity remains healthy.
Revenue growth has been uneven over the last several years, which is normal for an advertising business exposed to economic cycles. Even so, the most recent year-over-year trend has returned to positive territory, at roughly high-single-digit growth, which is better than the sector median. That suggests the business has regained forward momentum after a weaker stretch in 2024 and early 2025.
Cash generation is another area worth watching. Trailing free cash flow moved from negative levels in prior periods to positive territory more recently, and the latest metrics indicate annual free cash flow of roughly $70 million. For a company of this size, that is an encouraging sign because it improves financial flexibility, especially in a business with heavy fixed assets and material interest costs.
One of the clearest catalysts is the continued conversion of static displays into digital ones. Digital units can raise revenue per location and improve inventory utilization. Another catalyst is steadier demand in local advertising and airports, where occupancy and traveler flows can support better pricing. If management continues pairing revenue growth with tighter costs, operating leverage could remain meaningful.
Risks
This article is for informational purposes only and does not constitute financial advice. Some content is AI-generated. See Disclaimer


