Stock Analysis · Carnival Corporation (CCL)
Overview
Carnival Corporation is one of the world’s largest cruise companies. It operates a portfolio of well-known cruise brands including Carnival Cruise Line, Princess Cruises, Holland America Line, Cunard, AIDA Cruises, Costa Cruises, P&O Cruises, and Seabourn. In simple terms, the company sells vacation experiences at sea, combining transportation, lodging, dining, entertainment, and excursions into one product.
Its business is largely consumer-facing, but the model is broader than just ticket sales. Revenue mainly comes from passengers booking cruises and then spending more once onboard or through related travel services. Based on company reporting, the revenue mix is generally concentrated in two broad buckets:
- Passenger ticket revenue: usually the largest source, roughly around three-quarters of total revenue. This includes the base cruise fare.
- Onboard and other revenue: roughly around one-quarter of total revenue. This includes beverage packages, specialty dining, casino activity, Wi‑Fi, shore excursions, retail purchases, and other travel-related services.
Carnival’s scale matters because cruise operations require expensive ships, global port access, marketing reach, and complex logistics. That gives the industry relatively high barriers to entry. The company is also geographically diversified, with brands serving North America, Europe, and other international markets.
The multi-year financial picture shows a business that moved from severe pandemic disruption to much healthier profitability. Revenue has recovered strongly, operating income has turned positive again, and interest expense has started to ease as the balance sheet improves. The main issue that still stands out is that debt remains much higher than before the industry shutdown.
Key Figures
| Metric | Value | Sector ⓘ |
|---|---|---|
| Date | Sep 12, 2026 | |
| Context | ||
| Sector | Consumer Cyclical | |
| Industry | Travel Services | |
| Market Cap ⓘ | $31.16B | |
| Beta ⓘ | 2.31 | |
Value (Cheapness) | ||
| P/E Ratio ⓘ | 10.11 | 17.10 |
| FCF Yield ⓘ | 10.27% | 8.53% |
| EBIT / EV ⓘ | 7.80% | 6.46% |
| PEG ⓘ | 0.78 | |
Growth (Business expansion) | ||
| Revenue Growth ⓘ | 5.30% | 5.75% |
| RPS Growth (5Y CAGR) ⓘ | 82.84% | 9.14% |
| EPS Growth (5Y CAGR) ⓘ | N/A | -18.21% |
| Margin Growth (5Y Trend) ⓘ | 430.63% | -0.23% |
| FCF Growth (5Y CAGR) ⓘ | N/A | 4.91% |
Quality (Business durability) | ||
| ROIC (Latest) ⓘ | 11.23% | 12.61% |
| ROIC (5Y Median) ⓘ | 3.95% | 10.72% |
| Net Debt / EBIT (Latest) ⓘ | 5.57 | 2.10 |
| Net Debt / EBIT (5Y Median) ⓘ | 7.54 | 2.32 |
| Operating Margin (Latest) ⓘ | 15.72% | 9.25% |
| Operating Margin (5Y Median) ⓘ | 9.28% | 9.64% |
| Debt to Equity (Latest) ⓘ | 201.80% | 75.78% |
| Profit Margin (Latest) ⓘ | 11.24% | 5.33% |
| Free Cash Flow (Latest) ⓘ | $3.20B | |
Momentum (Price trend) | ||
| 3Y Return ⓘ | +49.52% | +14.53% |
| 12M Return (excl. last month) ⓘ | -5.15% | +3.08% |
| 6M Return ⓘ | -3.81% | +0.55% |
| Price vs. 200-Day MA ⓘ | -17.15% | -0.54% |
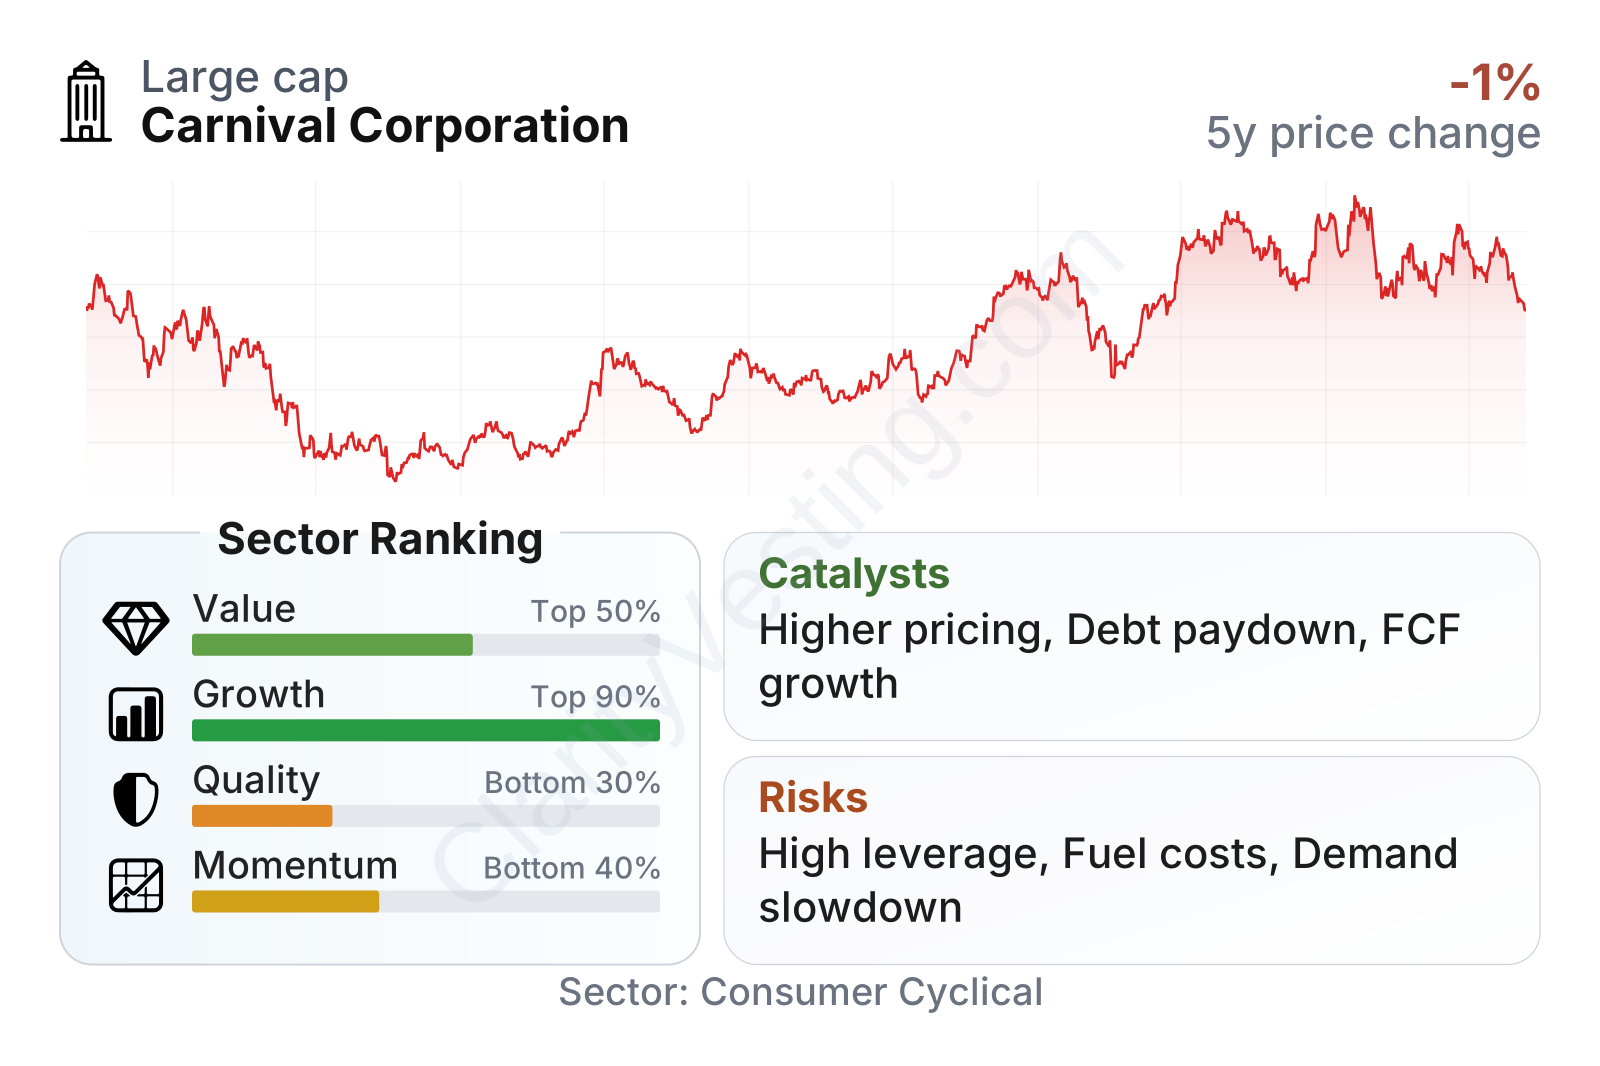
Carnival now has a market value above $40 billion, making it one of the larger listed names in travel services. The table points to a company with very strong growth characteristics and improving operating performance, but weaker balance-sheet quality than much of the sector. Revenue growth remains ahead of the sector median, margins have recovered sharply, and free cash flow has become meaningfully positive. At the same time, leverage is still elevated, which explains why quality metrics remain in the lower part of the peer group despite stronger profitability.
The stock’s volatility is also important to keep in mind. Its beta is well above 2, which means the share price has tended to move much more sharply than the broader market. That pattern fits the business: cruises are highly cyclical, sensitive to economic confidence, and still closely watched as a reopening and discretionary-spending story.
Growth
The cruise industry is part of the broader leisure and experiential travel market, a segment that has benefited from consumers prioritizing vacations and experiences over goods. Over the long run, cruising still has room for expansion because penetration remains relatively low compared with land-based vacations in many regions. That creates a favorable backdrop for large operators with strong brands and broad distribution.
Carnival’s recent growth has come less from speculative expansion and more from a practical recovery strategy: refill ships, improve pricing, lift onboard spending, and convert that demand into cash flow. That strategy has made sense so far. Occupancy and pricing have recovered, and the company has been using stronger demand to rebuild margins rather than simply chase volume.
Year-over-year revenue growth has naturally slowed from the extreme rebound phase, but the business is still expanding on top of a much larger base. That matters because it suggests the recovery is no longer just a one-time snapback from depressed levels. Instead, Carnival appears to be operating in a more normal environment where pricing discipline and onboard spending are becoming the main drivers.
One of the clearest improvements is cash generation. Free cash flow moved from deeply negative territory during the industry crisis to strongly positive levels over the last two years, reaching nearly $3 billion on a trailing basis. For a capital-intensive company, that is a major shift. Positive cash flow gives Carnival more flexibility to reduce debt, refinance obligations on better terms, and invest in fleet upgrades without depending as heavily on external funding.
Recent company updates have also pointed to continued customer demand, with booking trends, pricing, and onboard spending staying resilient. Another meaningful catalyst is lower interest burden over time if debt keeps declining and refinancing conditions improve. In Carnival’s case, even moderate progress on financing costs can have a visible effect on net income because interest expense has been such a large drag since the pandemic period.
Risks
This article is for informational purposes only and does not constitute financial advice. Some content is AI-generated. See Disclaimer


