Stock Analysis · Caseys General Stores Inc (CASY)
Overview
Casey’s General Stores is a convenience store chain centered on smaller cities and rural communities across the United States. The company operates stores that combine fuel sales, grocery and general merchandise, and prepared food. That mix matters because Casey’s is not just a gas station operator: it also has a meaningful inside-store retail business and a foodservice offering led by pizza, sandwiches, bakery items, and beverages.
The business model is built around frequent, everyday purchases. Fuel brings traffic to the stores, grocery and general merchandise add steady retail volume, and prepared food typically carries higher margins than fuel. Casey’s has also expanded through acquisitions and new-store openings, which has helped it increase its geographic reach beyond its traditional Midwest base.
Based on the latest annual filing, Casey’s revenue is mainly generated from the following categories:
- Fuel: approximately 59% of total revenue. This includes gasoline and diesel sold at the pump. It is the largest sales category, but not necessarily the most profitable one because fuel margins are usually thin.
- Grocery and general merchandise: approximately 29% of total revenue. This includes packaged food, candy, snacks, beverages, tobacco and nicotine products, health and beauty items, and other convenience-store merchandise.
- Prepared food and dispensed beverages: approximately 12% of total revenue. This includes pizza, bakery, hot sandwiches, breakfast items, fountain drinks, and other ready-to-eat products. This segment is smaller in sales but strategically important because margins are typically stronger.
Over the last several years, the company’s revenue, gross profit, operating income, and net income have all moved higher. Costs remain large because fuel is a low-margin business, but the overall earnings flow has improved as higher-margin categories and scale have grown.
Key Figures
| Metric | Value | Sector ⓘ |
|---|---|---|
| Date | Sep 14, 2026 | |
| Context | ||
| Sector | Consumer Cyclical | |
| Industry | Specialty Retail | |
| Market Cap ⓘ | $22.75B | |
| Beta ⓘ | 0.59 | |
Value (Cheapness) | ||
| P/E Ratio ⓘ | 29.62 | 17.10 |
| FCF Yield ⓘ | 2.85% | 8.53% |
| EBIT / EV ⓘ | 3.99% | 6.46% |
| PEG ⓘ | 2.78 | |
Growth (Business expansion) | ||
| Revenue Growth ⓘ | 24.30% | 5.75% |
| RPS Growth (5Y CAGR) ⓘ | 7.96% | 9.14% |
| EPS Growth (5Y CAGR) ⓘ | -13.74% | -18.19% |
| Margin Growth (5Y Trend) ⓘ | 1.49% | -0.23% |
| FCF Growth (5Y CAGR) ⓘ | 11.78% | 4.91% |
Quality (Business durability) | ||
| ROIC (Latest) ⓘ | 12.09% | 12.61% |
| ROIC (5Y Median) ⓘ | 17.45% | 10.72% |
| Net Debt / EBIT (Latest) ⓘ | 2.50 | 2.11 |
| Net Debt / EBIT (5Y Median) ⓘ | 2.54 | 2.32 |
| Operating Margin (Latest) ⓘ | 5.36% | 9.25% |
| Operating Margin (5Y Median) ⓘ | 4.85% | 9.64% |
| Debt to Equity (Latest) ⓘ | 70.55% | 75.99% |
| Profit Margin (Latest) ⓘ | 4.14% | 5.34% |
| Free Cash Flow (Latest) ⓘ | $648.93M | |
Momentum (Price trend) | ||
| 3Y Return ⓘ | +134.51% | +14.39% |
| 12M Return (excl. last month) ⓘ | +62.02% | +3.08% |
| 6M Return ⓘ | -8.53% | +0.55% |
| Price vs. 200-Day MA ⓘ | -15.48% | -0.54% |
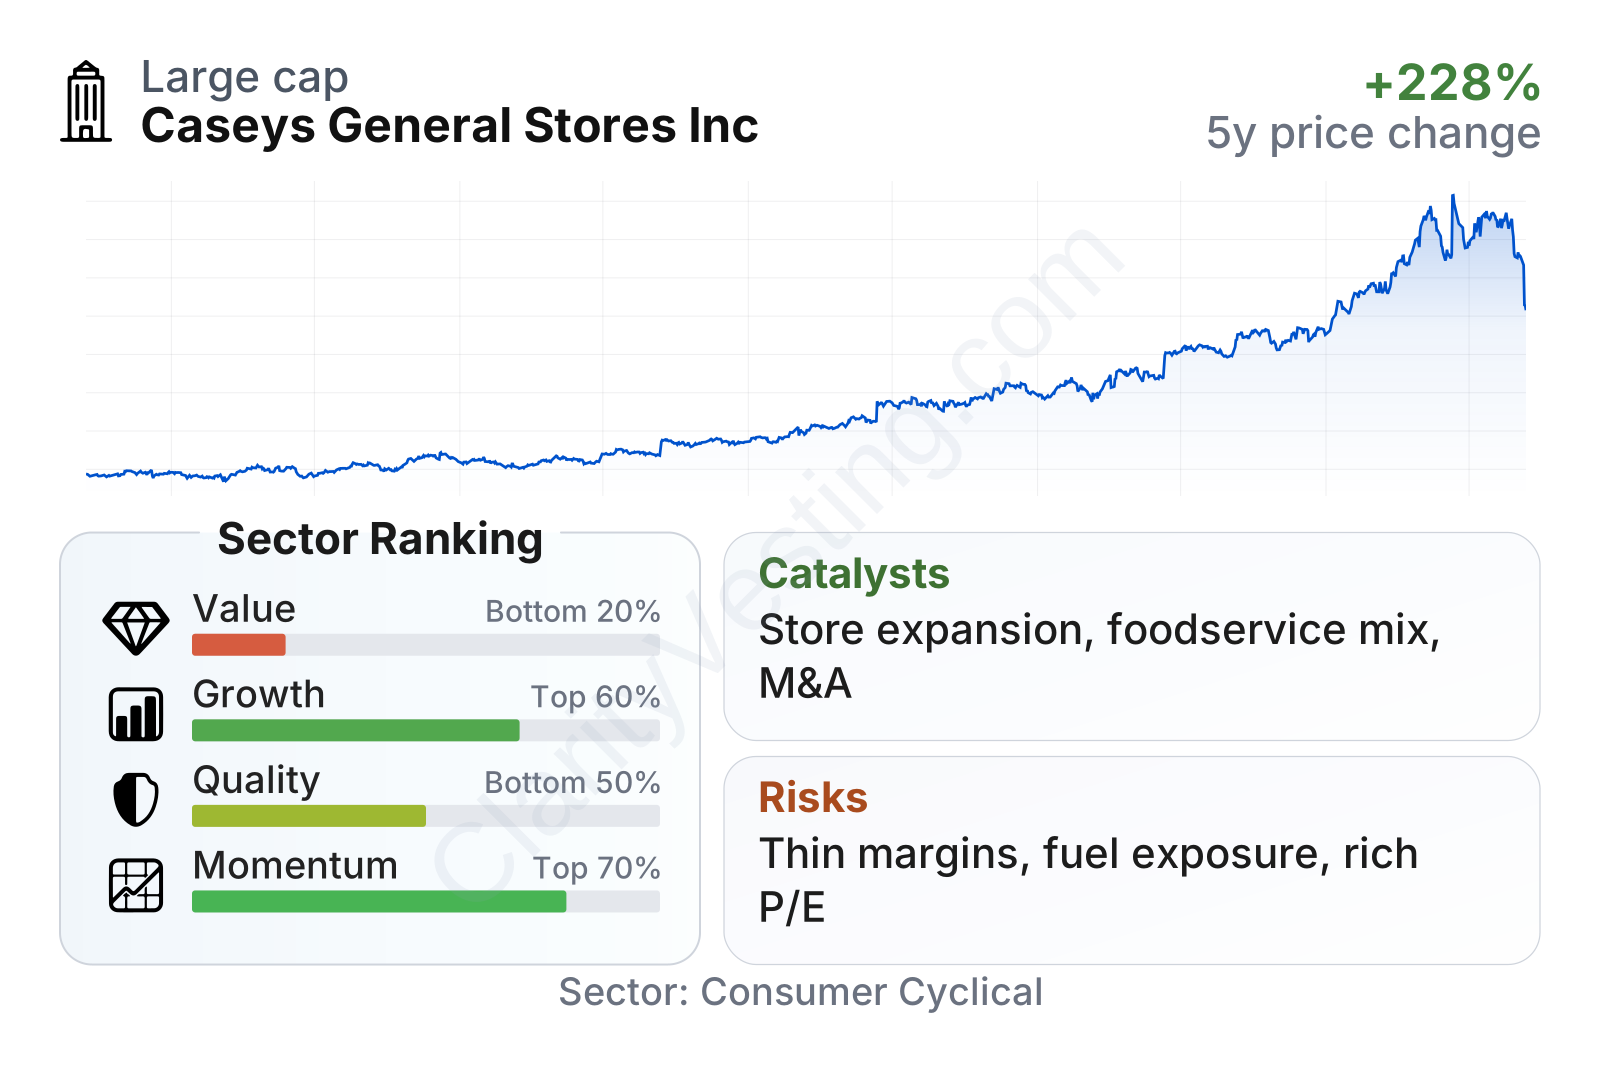
Casey’s is now a large public company with a market value above $20 billion, and its stock has been notably less volatile than the broader consumer discretionary space, as reflected by a beta well below 1. In the factor breakdown, growth and momentum rank above much of the sector, while value looks weak because the shares trade at a premium and free-cash-flow yield is relatively low. Quality is more mixed: long-term returns on invested capital have been solid, but margins remain modest and leverage is somewhat higher than ideal for a retailer priced at a premium.
Growth
Casey’s operates in a part of retail that tends to be resilient rather than flashy. Convenience stores benefit from recurring local demand, and Casey’s specific focus on small-town and rural markets gives it a niche that is harder for many larger retailers to replicate at the same density. The broader sector is not a high-growth industry in the technology sense, but it can still produce steady expansion through store openings, acquisitions, foodservice growth, and gains in same-store sales.
A central part of Casey’s strategy is sensible for long-term expansion. The company has been adding stores through both construction and acquisitions, increasing scale while building denser regional networks. That density can improve distribution efficiency, brand recognition, and customer convenience. Management has also emphasized digital capabilities, loyalty programs, and delivery, especially around prepared food. Those initiatives are important because they can increase visit frequency and basket size without relying only on fuel demand.
Revenue growth has not been perfectly smooth, which is normal in a business exposed to fuel prices and acquisition timing, but the recent pattern shows a clear reacceleration. The latest year-over-year growth rate is well above the sector median, and over a longer period sales per share have still compounded at a healthy pace. That suggests Casey’s is not growing only by issuing stock, but by building a larger operating base over time.
Cash generation is another positive point. Free cash flow has generally trended upward over the past few years despite some year-to-year variation, reaching roughly the high hundreds of millions of dollars on a trailing basis. That matters because a store-based business needs real cash to fund new locations, remodels, acquisitions, technology investments, debt service, and shareholder returns. Casey’s recent free-cash-flow trend supports the view that growth has been productive rather than purely cosmetic.
One of the strongest catalysts is the company’s food business. Prepared food and dispensed beverages are a much smaller share of revenue than fuel, but they tend to produce better profitability and help differentiate Casey’s from more basic convenience chains. Pizza remains a distinctive product for the brand, and the company’s efforts in delivery and digital ordering can deepen that advantage. Another catalyst is consolidation: convenience retail remains fragmented in many markets, giving Casey’s room to add stores and integrate them into its operating platform.
Recent company updates have also highlighted continued unit growth and integration activity, which points to an active expansion agenda rather than a mature chain simply defending its footprint. For a long-term view, that is important because it means Casey’s growth case depends on both organic improvement and external expansion.
Risks
This article is for informational purposes only and does not constitute financial advice. Some content is AI-generated. See Disclaimer


