Stock Analysis · Boost Run Inc (BRUN)
Overview
Boost Run Inc operates in software infrastructure, a part of the technology sector that typically includes platforms, tools, and systems used by businesses to run digital operations more efficiently. Based on the company’s recent public filings, Boost Run is still a relatively small listed company by sector standards, but it has expanded quickly over the last year. Revenue increased sharply from about $7.9 million in 2024 to about $26.9 million in 2025, showing that the business has moved into a much larger operating scale in a short period.
The latest filings do not appear to provide a detailed segment breakdown large enough to clearly separate revenue into several reported business lines with reliable percentages. That means the safest conclusion is that revenue is currently concentrated in its core software and infrastructure activities rather than spread across many independently reported divisions. For long-term analysis, this matters because a concentrated revenue base can support focus, but it can also make results more dependent on execution in a narrower set of products and customers.
What stands out in the operating profile is the gap between fast sales expansion and still-heavy operating costs. Gross profit rose strongly alongside revenue, which suggests the company’s offerings can scale, but selling, general, and administrative expenses also climbed materially. In simple terms, Boost Run has shown it can bring in more business, yet it has not converted that expansion into stable net profitability.
The business mix shows a company that scaled revenue and gross profit quickly between 2024 and 2025, but overhead and financing costs rose even faster. That combination helps explain why growth has been impressive while bottom-line performance remains under pressure.
Key Figures
| Metric | Value | Sector ⓘ |
|---|---|---|
| Date | Sep 14, 2026 | |
| Context | ||
| Sector | Technology | |
| Industry | Software - Infrastructure | |
| Market Cap ⓘ | $1.32B | |
| Beta ⓘ | N/A | |
Value (Cheapness) | ||
| P/E Ratio ⓘ | N/A | 29.51 |
| FCF Yield ⓘ | 6.98% | 4.25% |
| EBIT / EV ⓘ | N/A | 2.85% |
| PEG ⓘ | N/A | |
Growth (Business expansion) | ||
| Revenue Growth ⓘ | 269.70% | 15.40% |
| RPS Growth (5Y CAGR) ⓘ | N/A | 8.56% |
| EPS Growth (5Y CAGR) ⓘ | N/A | -11.88% |
| Margin Growth (5Y Trend) ⓘ | N/A | 0.46% |
| FCF Growth (5Y CAGR) ⓘ | N/A | 9.80% |
Quality (Business durability) | ||
| ROIC (Latest) ⓘ | N/A | 9.44% |
| ROIC (5Y Median) ⓘ | N/A | 8.30% |
| Net Debt / EBIT (Latest) ⓘ | N/A | 0.54 |
| Net Debt / EBIT (5Y Median) ⓘ | N/A | 0.44 |
| Operating Margin (Latest) ⓘ | N/A | 9.58% |
| Operating Margin (5Y Median) ⓘ | N/A | 8.25% |
| Debt to Equity (Latest) ⓘ | 357.44% | 33.33% |
| Profit Margin (Latest) ⓘ | -173.69% | 7.14% |
| Free Cash Flow (Latest) ⓘ | $92.23M | |
Momentum (Price trend) | ||
| 3Y Return ⓘ | N/A | +45.48% |
| 12M Return (excl. last month) ⓘ | +116.08% | +23.48% |
| 6M Return ⓘ | +54.41% | +20.93% |
| Price vs. 200-Day MA ⓘ | -7.30% | +7.43% |
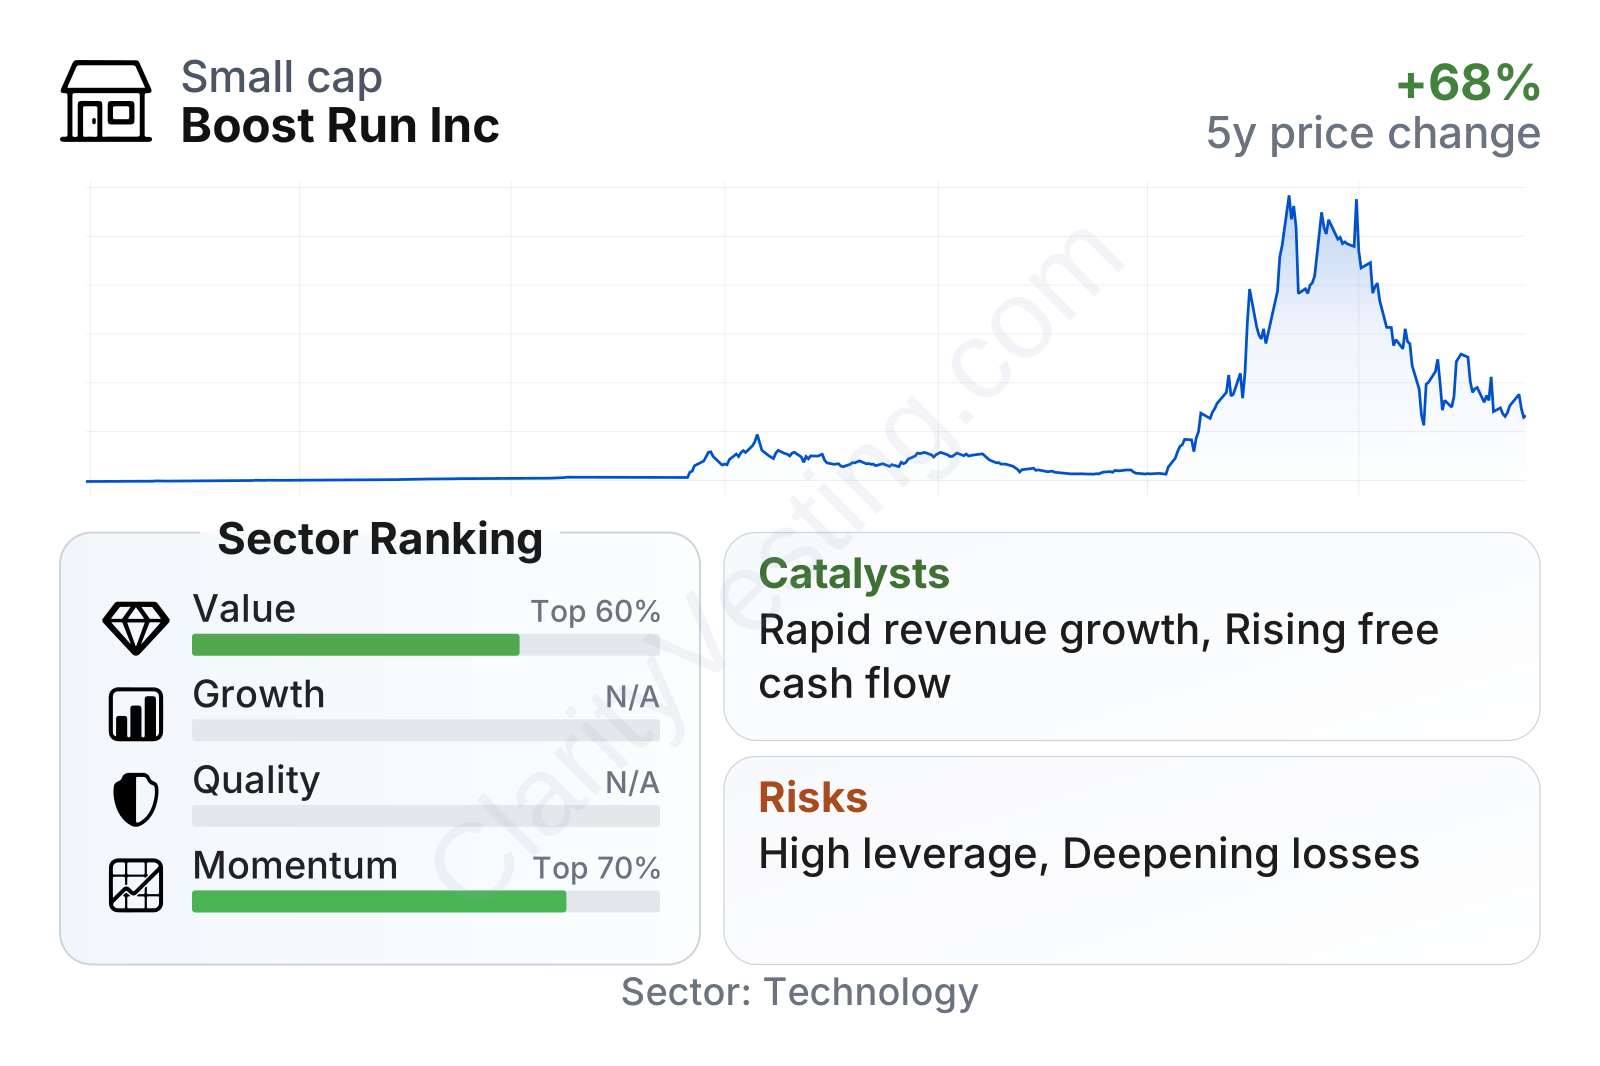
Boost Run sits in the small-cap range, which often brings higher upside potential but usually comes with higher volatility and execution risk. On value metrics, the company looks mixed rather than obviously cheap or expensive: free cash flow yield is above the sector median, which is a positive sign, but earnings-based valuation is harder to use because profitability has turned sharply negative. Momentum has been strong over the last year and the last six months, with stock performance well above the typical software infrastructure peer, although the shares have recently slipped below the 200-day moving average, a sign that the price trend has become less steady after a strong run.
Growth
Boost Run operates in a sector with favorable long-term demand. Software infrastructure remains tied to cloud usage, cybersecurity needs, data management, automation, and the broader digitalization of business operations. Those are durable industry drivers, and they create room for smaller companies if they offer a useful product and can win repeat business.
The company’s own recent numbers point to extremely rapid expansion. Year-over-year revenue growth has remained far above the sector median, with quarterly growth rates well above 100% and recently approaching 270%. That pace is not normal, even in technology, and it usually reflects either a very low starting base, major contract wins, acquisitions, or some combination of those factors. It clearly signals that Boost Run is still in an aggressive buildout phase rather than a mature operating phase.
Another encouraging point is cash generation. Trailing free cash flow moved up significantly over the recent period, rising from a low single-digit million-dollar level to more than $17 million by early 2026, and the latest summary metrics indicate free cash flow remains positive and substantially higher still. Positive cash flow matters because it can give a growing company more flexibility to fund operations, support product development, and reduce dependence on outside capital.
Strategically, the core question is whether Boost Run can turn rapid sales growth into a more efficient cost structure. If management can slow the growth of overhead while keeping revenue momentum strong, the business model could become much more attractive. The strongest observable catalyst today is therefore not just revenue growth by itself, but the possibility of operating leverage: each new dollar of revenue would become much more valuable if expenses begin to grow more slowly than sales.
Risks
This article is for informational purposes only and does not constitute financial advice. Some content is AI-generated. See Disclaimer


