Stock Analysis · Brightstar Lottery PLC (BRSL)
Overview
Brightstar Lottery PLC operates lottery and gaming businesses, with a business model centered on helping governments and licensed operators run lottery systems while also supplying gaming technology and digital services. The company is the renamed successor to International Game Technology’s former global lottery and gaming activities, so its profile combines relatively steady contracted lottery operations with more cyclical equipment and technology sales tied to gaming customers.
In practical terms, Brightstar earns money from long-term lottery management contracts, technology platforms used by lottery operators, sales and leasing of gaming machines and systems, and related digital services. Lottery tends to be the anchor of the business because it is often supported by multi-year agreements and recurring service revenue, while gaming equipment and software can move more with customer spending cycles.
Based on the company’s recent business mix as described in public filings, the main revenue sources can be summarized as follows:
- Lottery operations and services: approximately 55% to 65% of revenue. This includes operating national or regional lottery systems, instant ticket services, terminal networks, draw systems, and long-term technology contracts.
- Gaming equipment and systems: approximately 20% to 30% of revenue. This generally covers gaming machines, cabinets, replacement units, software, and casino systems.
- Digital, iGaming, and other technology services: approximately 10% to 20% of revenue. This includes online lottery tools, player account systems, remote content, and related service arrangements.
The broad pattern visible over recent years is a company with revenue that has stayed around the same general level after a much larger 2021 base, while profitability has remained meaningful thanks to strong gross margins and disciplined operating expenses. That mix matters for long-term analysis: this is not a pure high-growth digital platform, but a cash-generating infrastructure business serving regulated gaming markets.
The financial flow also shows a useful trait: revenue has been relatively stable around the mid-$2 billion range in recent years, and gross profit has remained strong even as net income moved around more sharply. That suggests the core business still has pricing power and recurring economics, while financing costs, taxes, and capital needs have had a larger effect on what ultimately reaches shareholders.
Key Figures
| Metric | Value | Sector ⓘ |
|---|---|---|
| Date | Sep 12, 2026 | |
| Context | ||
| Sector | Consumer Cyclical | |
| Industry | Gambling | |
| Market Cap ⓘ | $1.95B | |
| Beta ⓘ | 1.00 | |
Value (Cheapness) | ||
| P/E Ratio ⓘ | 11.71 | 17.10 |
| FCF Yield ⓘ | -113.34% | 8.53% |
| EBIT / EV ⓘ | 10.08% | 6.46% |
| PEG ⓘ | N/A | |
Growth (Business expansion) | ||
| Revenue Growth ⓘ | -7.40% | 5.75% |
| RPS Growth (5Y CAGR) ⓘ | -10.40% | 9.14% |
| EPS Growth (5Y CAGR) ⓘ | -43.93% | -18.21% |
| Margin Growth (5Y Trend) ⓘ | 4.71% | -0.23% |
| FCF Growth (5Y CAGR) ⓘ | N/A | 4.91% |
Quality (Business durability) | ||
| ROIC (Latest) ⓘ | 8.89% | 12.61% |
| ROIC (5Y Median) ⓘ | N/A | 10.72% |
| Net Debt / EBIT (Latest) ⓘ | 6.50 | 2.10 |
| Net Debt / EBIT (5Y Median) ⓘ | 6.65 | 2.32 |
| Operating Margin (Latest) ⓘ | 24.11% | 9.25% |
| Operating Margin (5Y Median) ⓘ | 27.88% | 9.64% |
| Debt to Equity (Latest) ⓘ | 523.17% | 75.78% |
| Profit Margin (Latest) ⓘ | 10.05% | 5.33% |
| Free Cash Flow (Latest) ⓘ | -$2.21B | |
Momentum (Price trend) | ||
| 3Y Return ⓘ | -50.54% | +14.53% |
| 12M Return (excl. last month) ⓘ | -20.94% | +3.08% |
| 6M Return ⓘ | -10.98% | +0.55% |
| Price vs. 200-Day MA ⓘ | -11.73% | -0.54% |
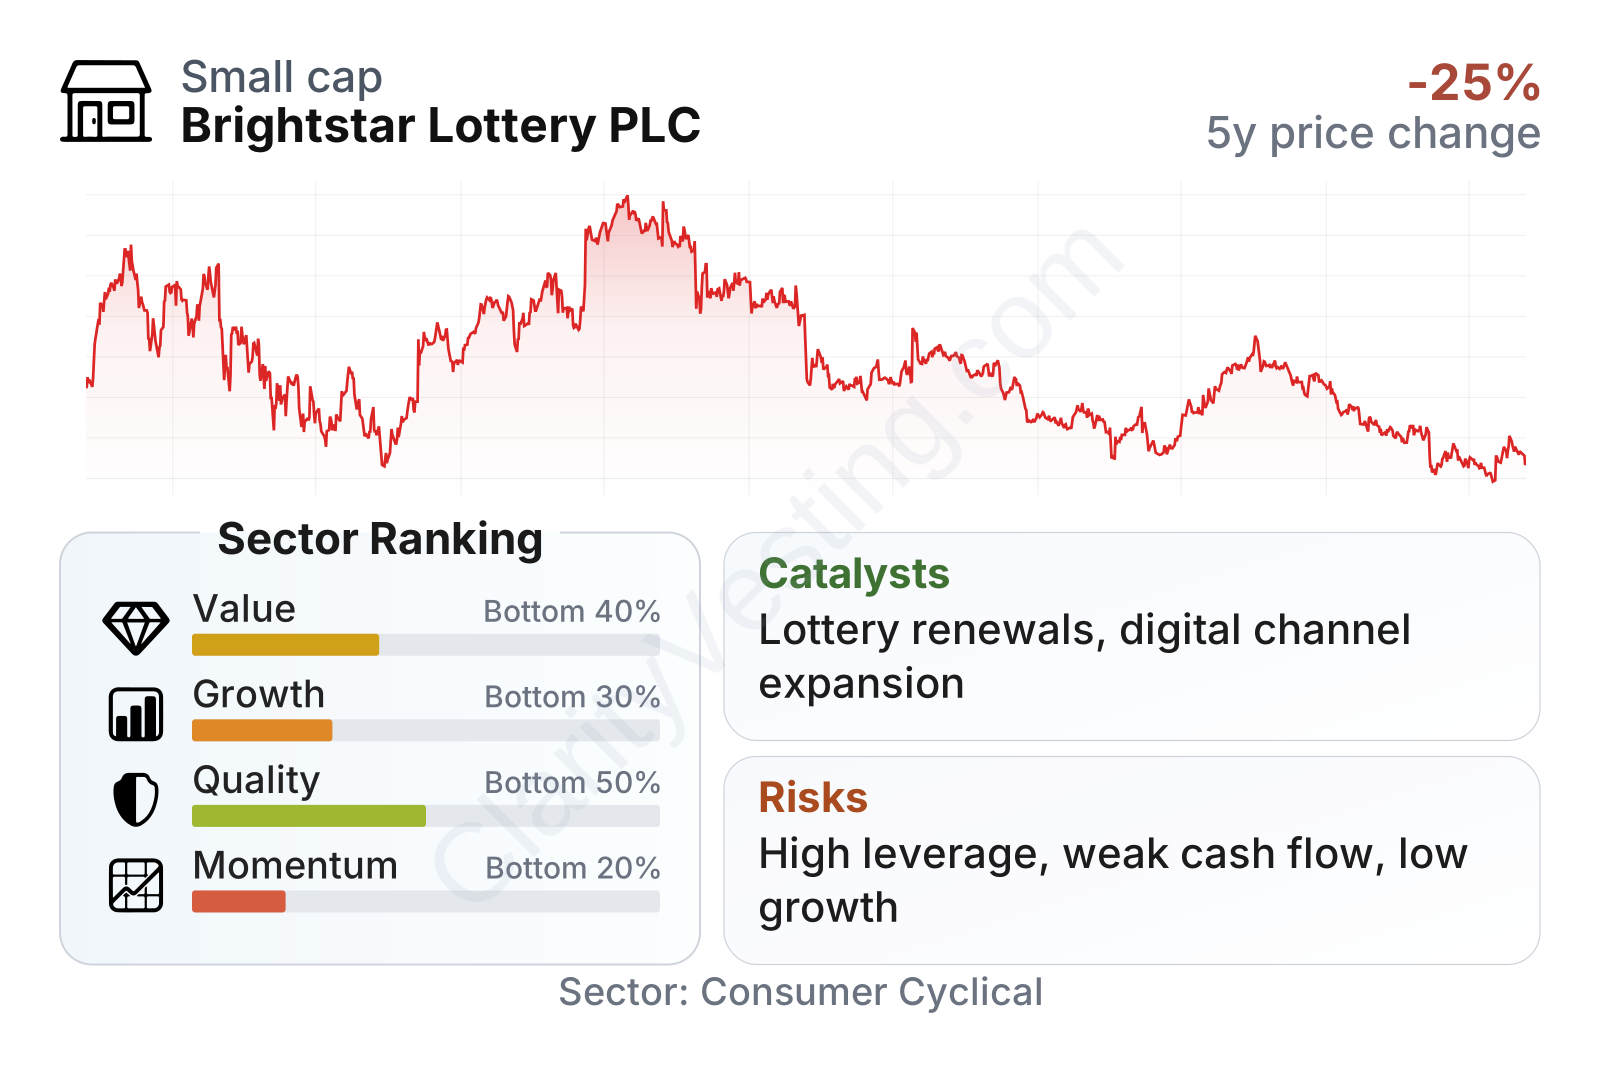
Brightstar is a mid-sized company with a market value near $2 billion and a stock volatility close to the broader market. The table points to a mixed profile. On valuation, the earnings multiple sits below the sector median, but that lower multiple comes with weak growth and currently negative free cash flow. On quality, operating and profit margins are better than many peers, yet leverage is far heavier than the sector norm. Momentum is the weakest area, reflecting a stock that has significantly lagged over multiple time frames.
The share-price history reinforces that picture. The stock has been volatile since 2021 and has trended downward over the last several years, indicating that the market has become more cautious about the company’s earnings durability, balance sheet, and growth path.
Growth
The lottery industry is generally a mature but resilient part of the gaming market. Growth usually comes less from rapid customer expansion and more from contract wins, digital migration, cross-selling technology, and improvements in same-store play. That means Brightstar operates in a sector with structural stability, but not one that naturally delivers fast organic growth.
Brightstar’s strategy still has logic for future expansion. Lottery remains one of the most defensible regulated gaming categories, and digital channels offer an opportunity to increase player engagement without needing to build a new physical network. The company also has experience running mission-critical systems for public-sector lottery customers, which can create switching costs and make contract renewals valuable.
Recent revenue performance has been uneven. Year-over-year growth briefly improved through parts of 2025 and early 2026, but the latest reading turned negative again, and the broader growth profile remains weak versus the sector. Over a five-year view, sales per share and earnings have both moved in the wrong direction, so the current challenge is not proving that the company can generate revenue, but proving that it can return to sustained expansion.
Free cash flow is the more important growth signal to watch right now. The business was producing strongly positive trailing free cash flow not long ago, but that has reversed sharply into negative territory. For a company in a mature industry, that swing matters because long-term upside depends on stable cash generation more than on headline revenue growth alone. If future quarters show normalization in cash conversion, that would materially improve the growth outlook.
One of the clearest catalysts is the company’s ability to renew or win lottery contracts and then attach more digital services to those agreements. Another is operational efficiency: Brightstar’s margins remain solid, so even modest revenue improvement can have a noticeable effect on earnings if capital spending and working capital become less demanding. In a regulated industry, scale and established customer relationships can also help the company benefit when governments modernize lottery platforms or expand digital participation.
Risks
This article is for informational purposes only and does not constitute financial advice. Some content is AI-generated. See Disclaimer


