Stock Analysis · BJs Restaurants Inc (BJRI)
Overview
BJ’s Restaurants, Inc. operates a casual dining restaurant chain in the United States under the BJ’s Restaurant & Brewhouse brand. The company serves a broad menu that includes pizza, burgers, sandwiches, salads, appetizers, desserts, and alcoholic beverages, with dine-in service still at the center of the business. It also has an in-house craft beer identity that helps differentiate the brand within casual dining. As of the latest company reporting in 2026, the business remains overwhelmingly restaurant-based rather than diversified across multiple unrelated segments.
Revenue mainly comes from food and beverage sales generated at company-owned restaurants, with a smaller contribution from off-premise occasions such as takeout and delivery. BJ’s does not report a large set of separate business segments, so the clearest way to think about revenue is by customer occasion and menu mix rather than by standalone divisions.
- Dine-in food and beverage sales: approximately 70% to 80% of revenue. This includes meals and drinks consumed in BJ’s dining rooms and bar areas.
- Takeout and delivery: approximately 20% to 30% of revenue. This includes off-premise orders placed directly or through delivery platforms.
- Other revenue: likely a very small share. This may include gift card breakage or minor ancillary items, but it is not a major driver of the business.
The business model is straightforward: attract traffic, keep average guest spending healthy, control food and labor costs, and turn restaurant-level sales into cash flow. Over the past few years, BJ’s has been working less on rapid unit expansion and more on improving operations, menu productivity, labor efficiency, and restaurant margins. That matters because in restaurants, small changes in costs and guest traffic can have an outsized effect on profits.
Financially, the company has moved from weak profitability after the industry disruption earlier in the decade toward better earnings and cash generation. Revenue has continued to edge upward, while operating income and net income have recovered much more sharply than sales, suggesting that margin improvement has recently been more important than pure top-line expansion.
The long-term pattern is encouraging: sales have risen from a little above $1.0 billion in 2021 to roughly $1.4 billion in 2025, while net income improved from a small loss to a much more solid profit. The notable shift is that earnings have recovered faster than revenue, which points to a more efficient cost structure than the company had a few years ago.
Key Figures
| Metric | Value | Sector ⓘ |
|---|---|---|
| Date | Sep 12, 2026 | |
| Context | ||
| Sector | Consumer Cyclical | |
| Industry | Restaurants | |
| Market Cap ⓘ | $1.29B | |
| Beta ⓘ | 1.30 | |
Value (Cheapness) | ||
| P/E Ratio ⓘ | 31.82 | 17.10 |
| FCF Yield ⓘ | 3.45% | 8.53% |
| EBIT / EV ⓘ | 2.48% | 6.46% |
| PEG ⓘ | 1.66 | |
Growth (Business expansion) | ||
| Revenue Growth ⓘ | 6.40% | 5.75% |
| RPS Growth (5Y CAGR) ⓘ | 7.18% | 9.14% |
| EPS Growth (5Y CAGR) ⓘ | 140.72% | -18.21% |
| Margin Growth (5Y Trend) ⓘ | 5.02% | -0.23% |
| FCF Growth (5Y CAGR) ⓘ | 16.64% | 4.91% |
Quality (Business durability) | ||
| ROIC (Latest) ⓘ | 9.86% | 12.61% |
| ROIC (5Y Median) ⓘ | 6.38% | 10.72% |
| Net Debt / EBIT (Latest) ⓘ | 9.98 | 2.10 |
| Net Debt / EBIT (5Y Median) ⓘ | 32.66 | 2.32 |
| Operating Margin (Latest) ⓘ | 2.94% | 9.25% |
| Operating Margin (5Y Median) ⓘ | 1.01% | 9.64% |
| Debt to Equity (Latest) ⓘ | 109.38% | 75.78% |
| Profit Margin (Latest) ⓘ | 2.86% | 5.33% |
| Free Cash Flow (Latest) ⓘ | $44.60M | |
Momentum (Price trend) | ||
| 3Y Return ⓘ | +119.98% | +14.53% |
| 12M Return (excl. last month) ⓘ | +103.03% | +3.08% |
| 6M Return ⓘ | +80.20% | +0.55% |
| Price vs. 200-Day MA ⓘ | +28.24% | -0.54% |
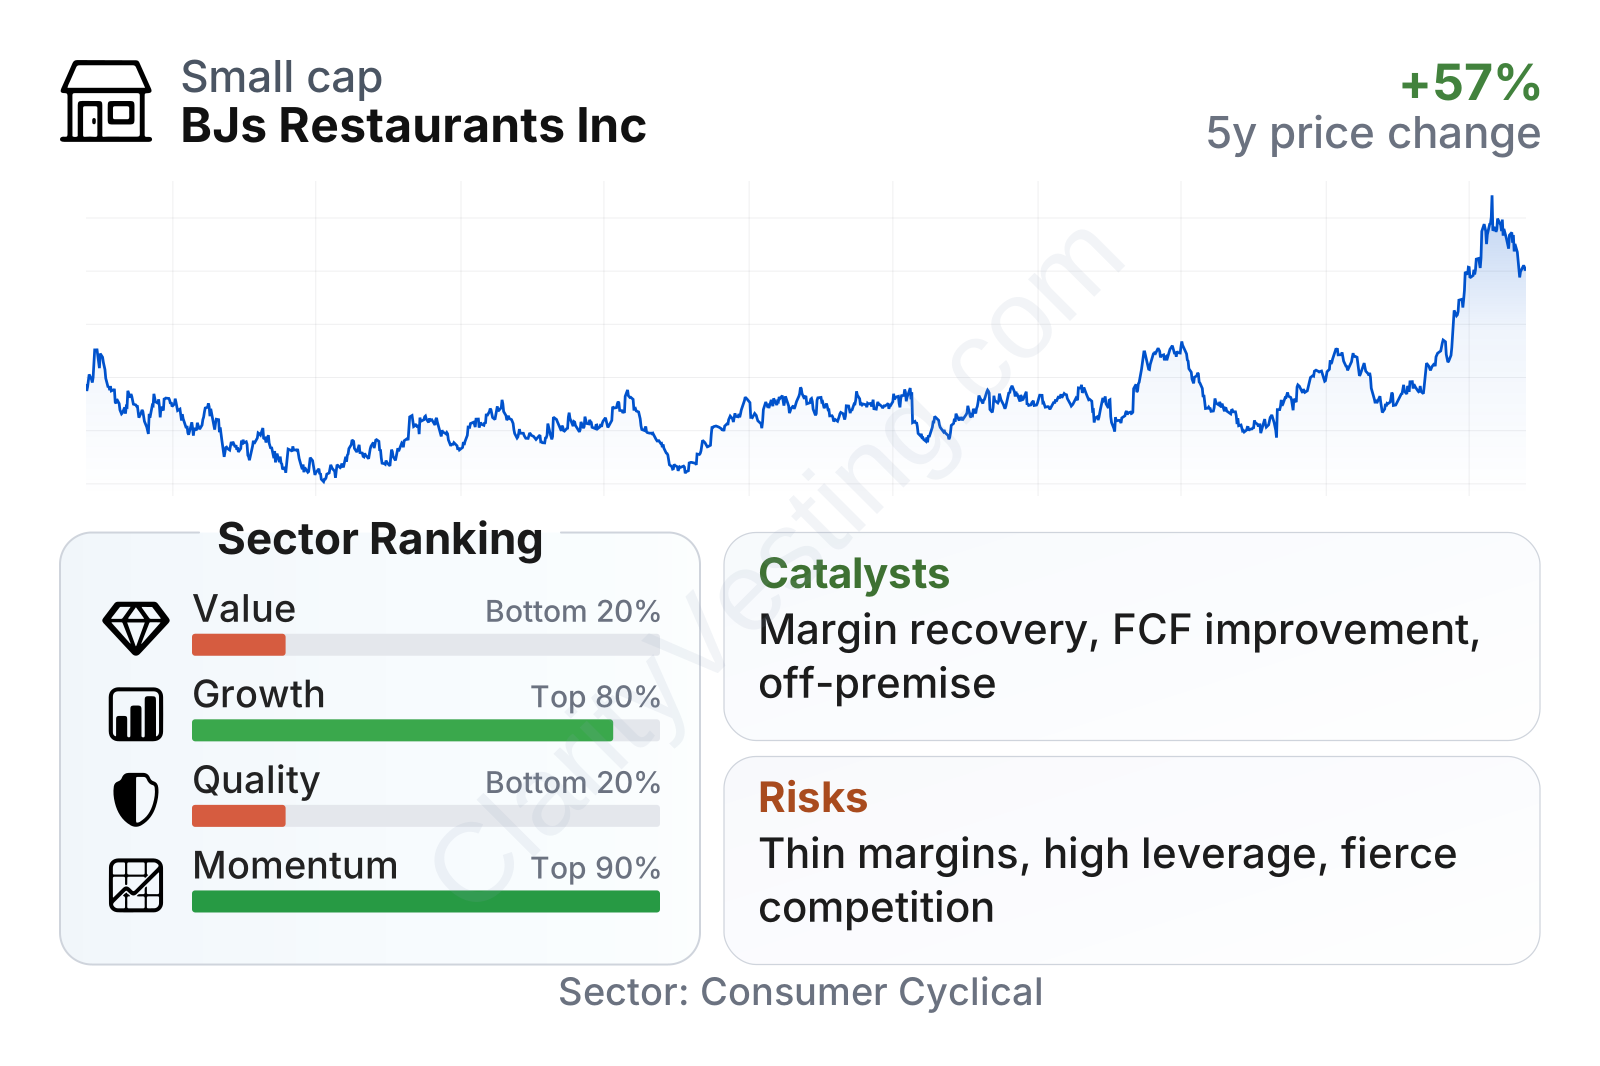
BJ’s sits in the mid-cap range and its share price has been more volatile than the broader market, which is common for restaurant stocks tied closely to consumer spending. The overall factor profile is mixed: momentum is very strong, growth is somewhat above the sector median, but value and quality rank much weaker. In plain terms, the market has rewarded the recent improvement, yet the stock is no longer obviously cheap and the balance between returns, margins, and debt still looks less robust than many peers.
The strongest elements in the current picture are the recent stock performance, improving cash generation, and a much better earnings base than the company had a few years ago. The weaker points are profitability relative to the sector, a debt load that remains elevated compared with operating earnings, and valuation multiples that now assume the operational recovery can continue.
Growth
The restaurant sector is mature, but it can still offer growth when a chain strengthens its brand, captures market share, and raises restaurant productivity. BJ’s is not operating in a fast-growing technology-style market; instead, its opportunity comes from improving execution in a large, steady dining category. Casual dining has been under pressure across the industry, yet stronger operators can still grow by taking share from weaker concepts, using digital ordering more effectively, and lifting sales per restaurant.
BJ’s recent strategy appears logical for this kind of environment. Management has focused on operational improvements, menu simplification, better labor deployment, and sales-building initiatives rather than aggressive expansion for its own sake. That is usually a sensible path for a restaurant chain whose economics depend heavily on traffic, labor efficiency, and consistent guest experience. If those efforts continue to improve restaurant-level margins, earnings can grow faster than revenue.
Revenue growth has normalized after the post-reopening surge. The company went from very high year-over-year growth rates earlier in the cycle to more modest low-single-digit expansion more recently, with a few uneven quarters along the way. The latest pace, around 6%, is slightly ahead of the sector median, which suggests BJ’s is still expanding, but no longer in a dramatic rebound phase.
Cash generation is one of the more important positive changes. Free cash flow moved from weak or even negative territory earlier in the recovery to a much stronger positive level more recently. That improvement matters because restaurants need cash for remodels, maintenance, debt reduction, and any future expansion. A company with improving free cash flow has more flexibility than one that relies mostly on accounting profits.
There are also a few practical catalysts behind the growth case. First, margin recovery has room to remain a major earnings driver even if revenue growth stays moderate. Second, BJ’s has off-premise sales that can support convenience-driven demand without requiring entirely new restaurant openings. Third, menu innovation and limited-time offers remain important tools in casual dining, especially for a brand that already has broad menu appeal and a differentiated dessert and beer offering.
Recent company updates have also highlighted continued attention to sales-building, restaurant productivity, and disciplined capital allocation. None of these alone transforms the business, but together they support a clearer path to steadier earnings growth than BJ’s had earlier in the decade.
Risks
This article is for informational purposes only and does not constitute financial advice. Some content is AI-generated. See Disclaimer


