Stock Analysis · Benchmark Electronics Inc (BHE)
Overview
Benchmark Electronics is a manufacturing and engineering services company that helps other businesses design, build, test, and manage complex electronic products. In simple terms, it is a behind-the-scenes partner for customers that need highly reliable equipment rather than mass-market gadgets. Its work is used in markets such as medical technologies, industrial equipment, aerospace and defense, advanced computing, and semiconductor-related systems.
The company mainly earns revenue by manufacturing electronic assemblies and complete products for customers, while also providing higher-value engineering and supply chain services. Based on recent company disclosures, revenue is organized primarily by end market rather than by individual service line.
- Industrial: approximately 35% to 40% of revenue. This includes automation, power and energy, and other industrial equipment.
- Medical: approximately 25% to 30% of revenue. This covers medical devices and healthcare-related equipment where quality and regulatory standards matter.
- Advanced Computing & Communication: approximately 15% to 20% of revenue. This includes computing infrastructure, networking, and communications hardware.
- Semi-Cap: approximately 10% to 15% of revenue. This refers to equipment used in semiconductor production.
- Aerospace & Defense: approximately 10% to 15% of revenue. This includes highly reliable electronics for defense and aerospace programs.
What stands out is that Benchmark is not trying to compete as a consumer electronics brand. Instead, it focuses on lower-volume, higher-complexity products where customers often value reliability, regulatory compliance, and long manufacturing relationships. That niche can be more stable than commodity electronics assembly, although it does not eliminate cyclicality.
The flow of the business over the last several years shows a familiar pattern for contract manufacturers: a very large share of revenue is absorbed by production costs, leaving relatively thin operating profit. Revenue expanded strongly into 2022, then moderated, while gross profit stayed comparatively steady. That suggests the company has maintained a reasonable level of activity, but with limited room for error when volumes or customer mix weaken.
Key Figures
| Metric | Value | Sector ⓘ |
|---|---|---|
| Date | Sep 12, 2026 | |
| Context | ||
| Sector | Technology | |
| Industry | Electronic Components | |
| Market Cap ⓘ | $2.79B | |
| Beta ⓘ | 1.27 | |
Value (Cheapness) | ||
| P/E Ratio ⓘ | 50.85 | 29.51 |
| FCF Yield ⓘ | 4.51% | 4.25% |
| EBIT / EV ⓘ | 3.71% | 2.85% |
| PEG ⓘ | 1.33 | |
Growth (Business expansion) | ||
| Revenue Growth ⓘ | 17.70% | 15.40% |
| RPS Growth (5Y CAGR) ⓘ | 4.06% | 8.56% |
| EPS Growth (5Y CAGR) ⓘ | -15.31% | -11.88% |
| Margin Growth (5Y Trend) ⓘ | 0.68% | 0.46% |
| FCF Growth (5Y CAGR) ⓘ | N/A | 9.80% |
Quality (Business durability) | ||
| ROIC (Latest) ⓘ | 4.68% | 9.44% |
| ROIC (5Y Median) ⓘ | 6.74% | 8.30% |
| Net Debt / EBIT (Latest) ⓘ | -0.39 | 0.54 |
| Net Debt / EBIT (5Y Median) ⓘ | 0.46 | 0.44 |
| Operating Margin (Latest) ⓘ | 3.45% | 9.58% |
| Operating Margin (5Y Median) ⓘ | 3.37% | 8.25% |
| Debt to Equity (Latest) ⓘ | 24.84% | 33.33% |
| Profit Margin (Latest) ⓘ | 1.89% | 7.14% |
| Free Cash Flow (Latest) ⓘ | $126.12M | |
Momentum (Price trend) | ||
| 3Y Return ⓘ | +242.84% | +45.48% |
| 12M Return (excl. last month) ⓘ | +109.28% | +23.48% |
| 6M Return ⓘ | +45.41% | +20.93% |
| Price vs. 200-Day MA ⓘ | +16.11% | +7.43% |
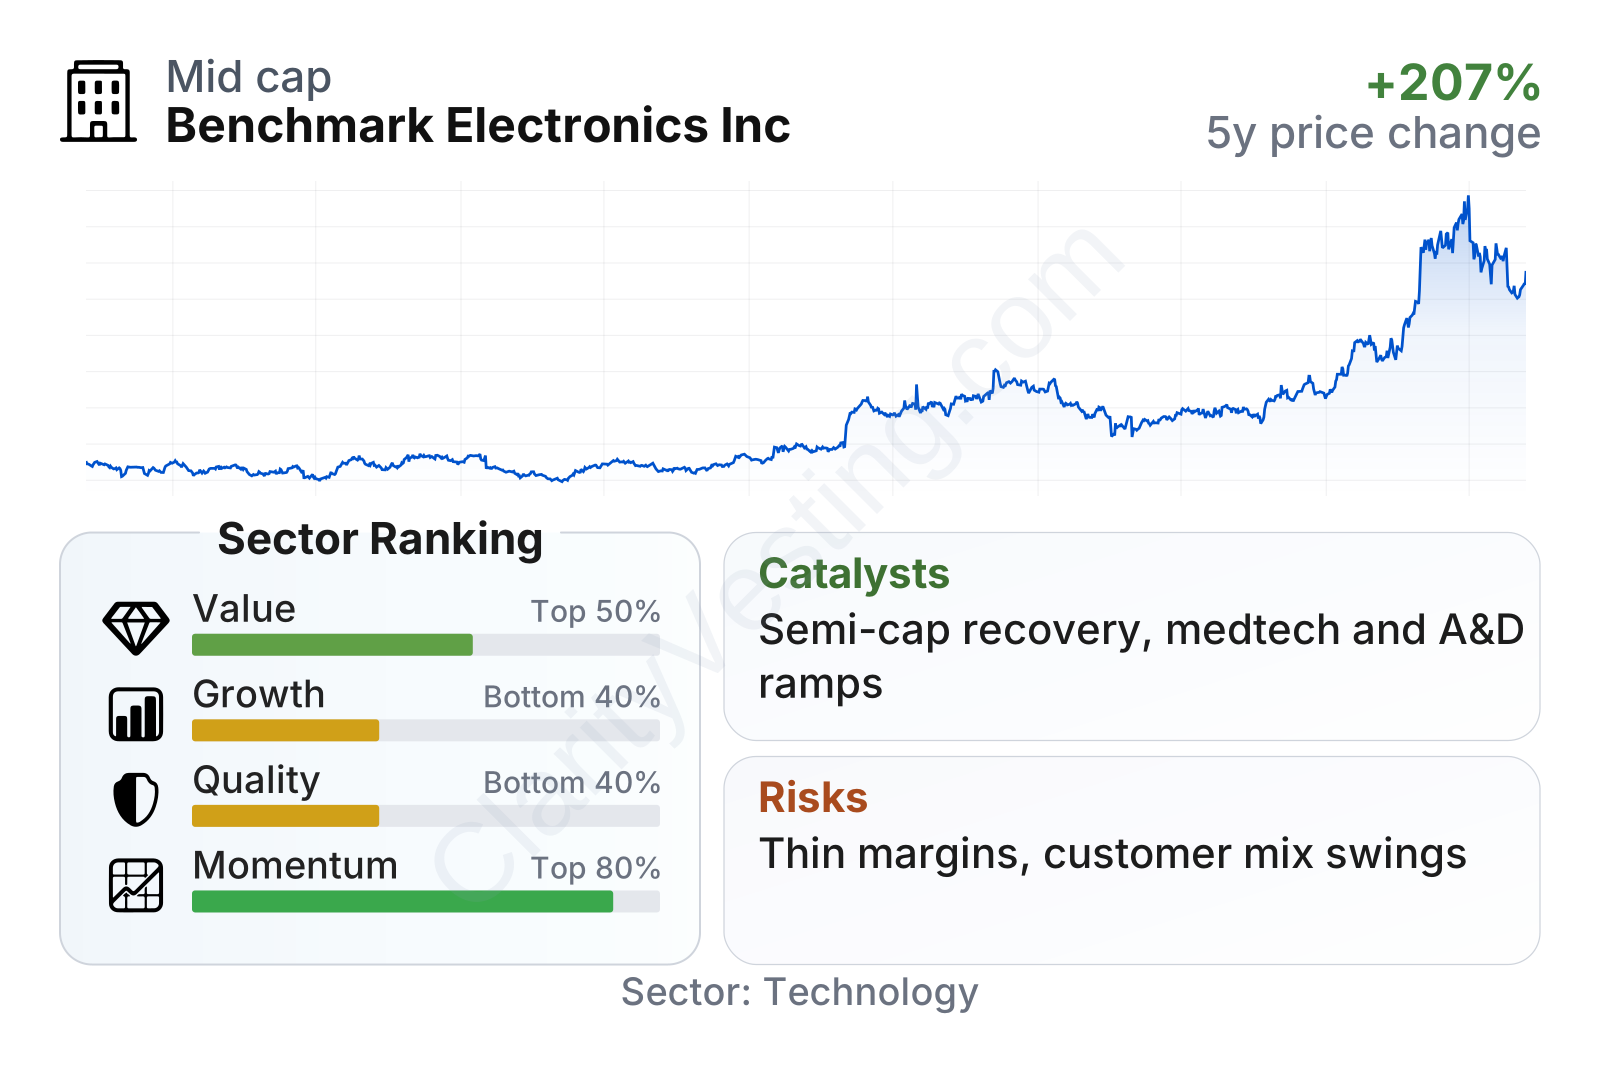
Benchmark is a mid-sized technology manufacturer with a stock that has been much stronger than most of its sector over the last year and over the last three years. The balance sheet looks disciplined, with debt below the sector median and net debt effectively negative relative to EBIT, which points to financial flexibility. Cash generation is also respectable relative to the company’s size. The weaker area is business quality: returns on invested capital and operating profitability remain below the sector median, which is common in manufacturing-heavy businesses but still worth watching closely. Growth metrics are mixed, with a recent rebound in revenue but a more modest long-term growth record.
Growth
Benchmark operates in several markets that should remain relevant for years: medical devices, industrial automation, aerospace and defense electronics, and semiconductor equipment. These are not all fast-growing every year, but they are supported by durable long-term themes such as factory automation, electrification, more sophisticated medical equipment, and rising electronics content in mission-critical systems. That gives the company exposure to sectors where complexity and reliability matter more than pure scale.
The company’s strategy also makes sense for future growth. Benchmark has emphasized higher-value programs, engineering participation earlier in the product cycle, and focus on regulated or demanding end markets where customers are less likely to switch suppliers purely on price. For a company like this, the goal is not only to win more manufacturing volume, but to become more embedded in customer products from the design stage onward. If that works, customer relationships can become stickier and margins can improve gradually.
Revenue growth has been volatile, which is normal in electronics manufacturing. After a period of contraction, recent year-over-year growth turned positive again and accelerated into the latest period, rising to the high teens. That recovery matters because it suggests customer demand and program ramps are improving after a softer phase in 2024 and 2025. Even so, the longer five-year revenue-per-share trend is still below the sector median, so one strong rebound does not yet prove a consistently higher growth profile.
Free cash flow also improved sharply from negative levels earlier in the cycle to clearly positive territory more recently, although it has come down from its peak. That pattern suggests the company benefited from working-capital normalization and better operating conditions, but cash generation is still somewhat uneven. For a long-term assessment, the important point is that Benchmark has shown it can convert business activity into cash, even if that conversion is not perfectly smooth from year to year.
A meaningful catalyst is Benchmark’s exposure to semiconductor capital equipment and aerospace and defense programs. These areas can support growth when customers launch new platforms or increase production. The company has also continued to discuss program wins and expansion in complex markets through its investor communications, which supports the idea that the recent recovery is linked to real business momentum rather than only temporary cost actions.
Risks
This article is for informational purposes only and does not constitute financial advice. Some content is AI-generated. See Disclaimer


