Stock Analysis · Boyd Group Services Inc (BGSI)
Overview
Boyd Group Services Inc. operates one of the largest automotive collision repair networks in North America. The company is best known through brands such as Gerber Collision & Glass, Glass America, Boyd Autobody & Glass, and Assured Automotive. Its business is centered on repairing damaged vehicles, replacing and repairing automotive glass, and serving insurance-driven repair demand. In practical terms, Boyd benefits when vehicles need collision work after accidents and when drivers or fleet operators need windshield or glass services.
The company’s revenue comes mainly from repair and related services rather than from vehicle sales. Based on company disclosures, the business mix is concentrated in collision repair, with glass services representing a smaller but still meaningful contribution.
- Collision and paint repair services: approximately 80% to 90% of revenue. This includes body work, mechanical and structural repairs tied to accident damage, calibration work, paint, and insurer-managed claims.
- Automotive glass repair and replacement: approximately 10% to 20% of revenue. This includes windshield replacement, chip repair, side and rear glass work, and related mobile service.
- Other revenue: a small residual amount from related services, parts handling, and ancillary shop activities when disclosed as part of broader operating categories.
Geographically, Boyd generates the large majority of its revenue in the United States, with the remainder coming from Canada. The company’s operating model relies on a broad shop network, insurer relationships, and acquisitions of independent repair centers that are later integrated into its platform.
The long-term business picture is mixed in an important way: revenue has expanded materially over the last several years, but more of each sales dollar is being absorbed by operating costs, interest expense, and margin pressure than was the case during Boyd’s stronger profit years.
Over the past few years, total revenue has moved from below $2 billion to above $3 billion, showing the scale benefit of network growth and acquisitions. At the same time, net income has fallen sharply from earlier peaks, indicating that growth has recently come with weaker profitability.
Key Figures
| Metric | Value | Sector ⓘ |
|---|---|---|
| Date | Sep 12, 2026 | |
| Context | ||
| Sector | Consumer Cyclical | |
| Industry | Auto & Truck Dealerships | |
| Market Cap ⓘ | $2.27B | |
| Beta ⓘ | 0.67 | |
Value (Cheapness) | ||
| P/E Ratio ⓘ | 185.34 | 17.10 |
| FCF Yield ⓘ | 14.54% | 8.53% |
| EBIT / EV ⓘ | 2.83% | 6.46% |
| PEG ⓘ | N/A | |
Growth (Business expansion) | ||
| Revenue Growth ⓘ | 29.90% | 5.75% |
| RPS Growth (5Y CAGR) ⓘ | 12.54% | 9.14% |
| EPS Growth (5Y CAGR) ⓘ | -9.42% | -18.21% |
| Margin Growth (5Y Trend) ⓘ | -0.07% | -0.23% |
| FCF Growth (5Y CAGR) ⓘ | 14.58% | 4.91% |
Quality (Business durability) | ||
| ROIC (Latest) ⓘ | 3.00% | 12.61% |
| ROIC (5Y Median) ⓘ | N/A | 10.72% |
| Net Debt / EBIT (Latest) ⓘ | 16.36 | 2.10 |
| Net Debt / EBIT (5Y Median) ⓘ | 10.03 | 2.32 |
| Operating Margin (Latest) ⓘ | 3.42% | 9.25% |
| Operating Margin (5Y Median) ⓘ | 3.28% | 9.64% |
| Debt to Equity (Latest) ⓘ | 117.12% | 75.78% |
| Profit Margin (Latest) ⓘ | 0.25% | 5.33% |
| Free Cash Flow (Latest) ⓘ | $330.04M | |
Momentum (Price trend) | ||
| 3Y Return ⓘ | -49.12% | +14.53% |
| 12M Return (excl. last month) ⓘ | -23.89% | +3.08% |
| 6M Return ⓘ | -41.16% | +0.55% |
| Price vs. 200-Day MA ⓘ | -29.84% | -0.54% |
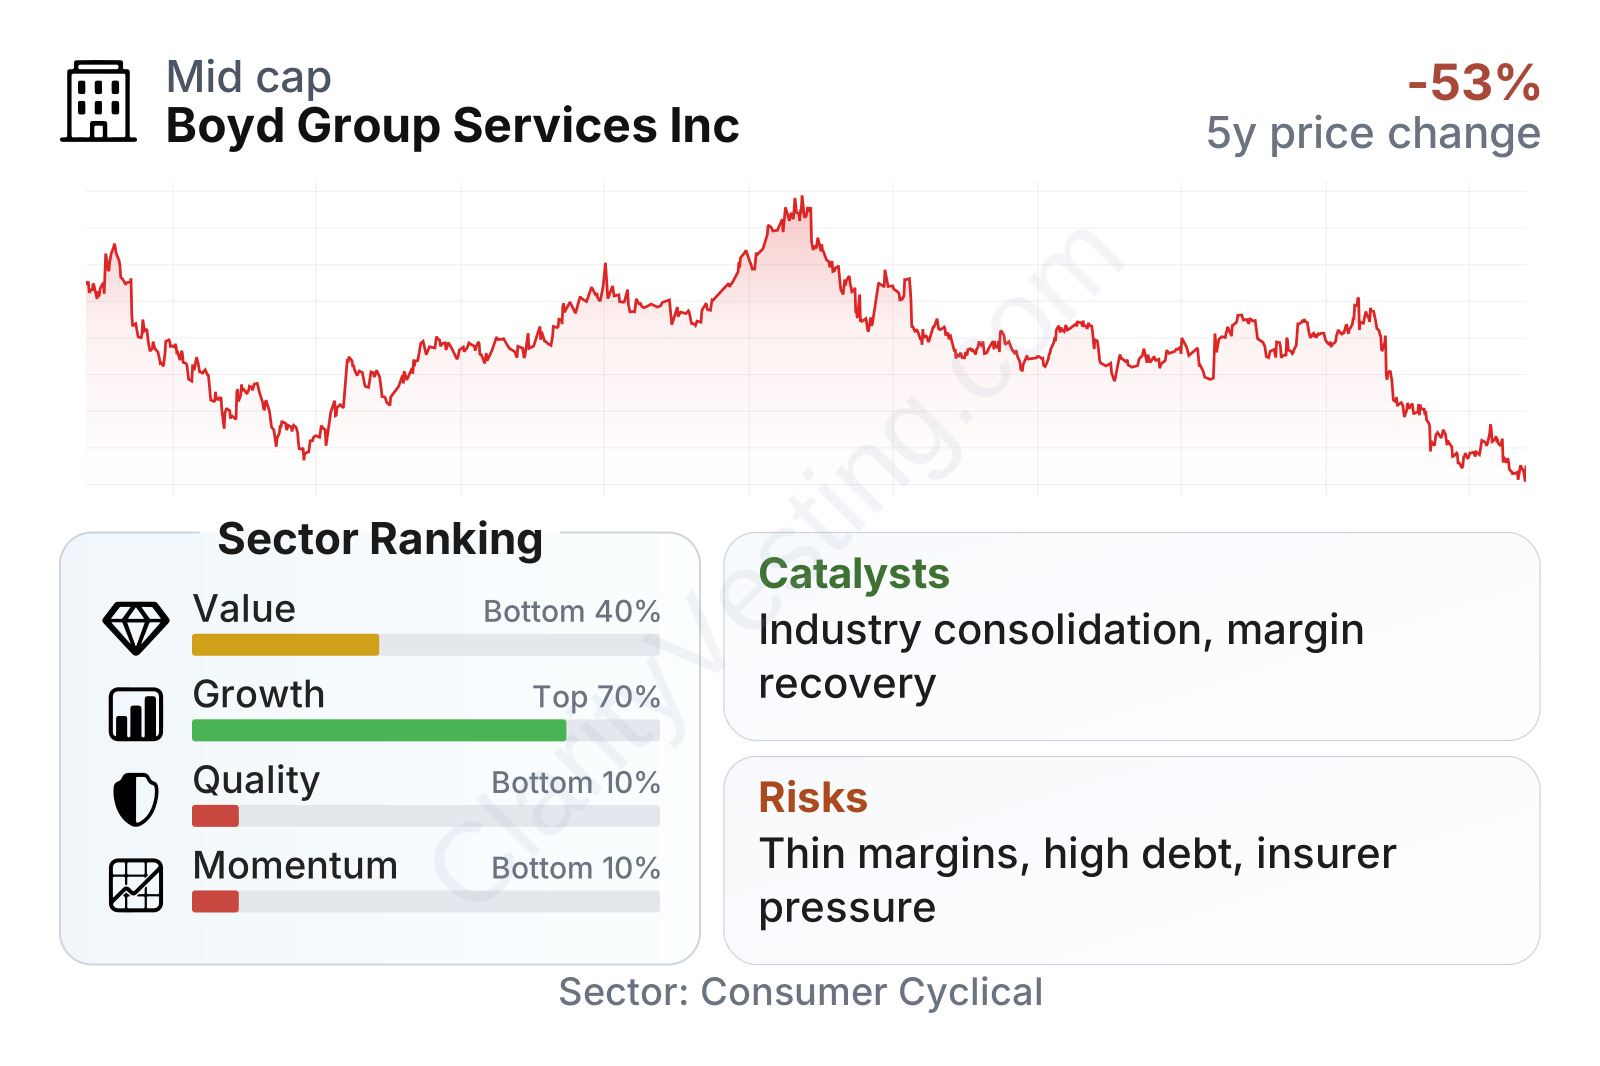
Boyd is a mid-sized public company with a relatively low beta, meaning its share price has historically been somewhat less volatile than the broader market. The broader factor picture is less favorable. Growth metrics are stronger than many sector peers, especially on recent revenue growth and multi-year free cash flow expansion, but quality, profitability, and share-price momentum rank near the bottom of the sector. The most striking contrast is that cash generation remains meaningful while earnings-based valuation and returns on capital look weak.
The stock chart also shows a business that has gone through a major market re-rating. After reaching much higher levels in earlier years, the shares have pulled back sharply, reflecting lower confidence in margins, debt burden, and earnings durability rather than a collapse in revenue.
Growth
Boyd operates in a sector with durable underlying demand. Vehicle collisions do not disappear in slower economies, and modern cars are becoming more complex to repair because of sensors, cameras, calibration requirements, advanced materials, and higher parts costs. That complexity tends to favor scaled repair operators that can invest in equipment, technician training, procurement, and insurer relationships. This is one reason the collision repair market remains attractive for consolidators.
Boyd’s strategy is also logically aligned with that industry structure. The company continues to grow through a combination of same-store activity, new locations, and acquisitions of independent repair businesses. A fragmented market gives large operators room to add shops over time, and Boyd’s established brands and insurer connections can make acquired shops more productive after integration.
Recent revenue growth has accelerated sharply, moving from low or even slightly negative levels in parts of 2025 to around 26% to 30% in the first half of 2026. That is far above the sector median and suggests that acquisitions and network expansion have had a visible effect. However, this kind of jump also raises the next question: whether the company can convert that stronger top-line growth into healthier earnings.
Free cash flow gives Boyd a more constructive growth angle than net income alone. Trailing twelve-month free cash flow has improved from roughly $250 million to about $330 million across the displayed period. That matters because a roll-up strategy needs cash to fund acquisitions, maintain facilities, and manage debt. If cash generation continues to hold up, it gives the company more flexibility than the earnings line might suggest.
A notable catalyst is the continued consolidation opportunity in North American collision repair. Many operators remain local or regional, while insurers often prefer partners with broader geographic coverage, process consistency, and digital claims handling. Boyd is already one of the largest participants in this niche, so it is in a position to benefit if the market keeps shifting toward scaled operators. Another supportive factor is rising repair complexity in newer vehicles, which can increase average repair ticket values over time.
Risks
This article is for informational purposes only and does not constitute financial advice. Some content is AI-generated. See Disclaimer


