Stock Analysis · AMC Entertainment Holdings Inc (AMC)
Stock Analysis · AMC Entertainment Holdings Inc (AMC)

Overview

AMC Entertainment Holdings is one of the largest movie theater operators in the world. The company runs theaters primarily in the United States and Europe, selling movie tickets and a wide range of food and beverages. Its business is still built around the cinema experience, but management has also tried to broaden revenue through premium large-format screens, upgraded seating, loyalty programs, advertising, and a small but visible push into branded retail products such as popcorn sold outside theaters.

For a simple way to think about AMC, the company makes money when people go to the movies, spend on concessions, and when studios deliver enough appealing films to keep theaters busy throughout the year. That means AMC is not just tied to its own execution; it also depends heavily on the health of the film release calendar and consumer entertainment habits.

Based on recent annual filings, AMC’s revenue mix is roughly organized this way:

  • Admissions: about half of total revenue, generally around 50% to 55%. This is ticket sales and remains the largest source.
  • Food and beverage: roughly 30% to 35%. This is a crucial profit driver because concession sales usually carry better margins than tickets.
  • Other theater revenue: roughly 10% to 15%. This includes items such as screen advertising, theater rentals, loyalty-related activity, and other on-site revenue.
  • Non-theater and ancillary activity: still a small share, including newer retail and branded initiatives.

That structure matters because AMC’s long-term economics depend less on ticket volume alone than on whether each guest spends more per visit and whether premium formats help lift revenue per screen.

The company’s recent financial path shows a meaningful rebound in revenue since the pandemic period, but profitability remains pressured by operating costs and especially by heavy interest expense. AMC has improved from the deepest crisis years, yet it is still working through a balance sheet that remains much more strained than most companies in its sector.

The broad trend is recovery in revenue and gross profit compared with the pandemic era, but that improvement has not fully flowed through to net income. Interest costs remain a major drag, which helps explain why stronger attendance and better concession sales have not yet translated into durable bottom-line profitability.

Key Figures

MetricValueSector
DateJul 18, 2026
Context
SectorCommunication Services
IndustryEntertainment
Market Cap $1.73B
Beta 2.28
Value
(Cheapness)
P/E Ratio N/A19.52
FCF Yield -7.14%12.73%
EBIT / EV 0.09%4.37%
PEG 12.22
Growth
(Business expansion)
Revenue Growth 21.20%6.10%
RPS Growth (5Y CAGR) -19.23%5.02%
EPS Growth (5Y CAGR) -53.61%-26.68%
Margin Growth (5Y Trend) N/A0.79%
FCF Growth (5Y CAGR) -15.41%5.18%
Quality
(Business durability)
ROIC (Latest) 0.31%8.74%
ROIC (5Y Median) -3.42%8.07%
Net Debt / EBIT (Latest) 867.632.09
Net Debt / EBIT (5Y Median) N/A3.02
Operating Margin (Latest) 0.17%15.46%
Operating Margin (5Y Median) -2.01%13.17%
Debt to Equity (Latest) -411.59%59.09%
Profit Margin (Latest) -10.88%9.11%
Free Cash Flow (Latest) -$123.60M
Momentum
(Price trend)
3Y Return -95.50%+36.38%
12M Return (excl. last month) -11.33%+8.16%
6M Return +21.25%+2.31%
Price vs. 200-Day MA +6.70%+1.57%
Better than sector median
Slightly worse than sector median
More than 20% worse than sector median

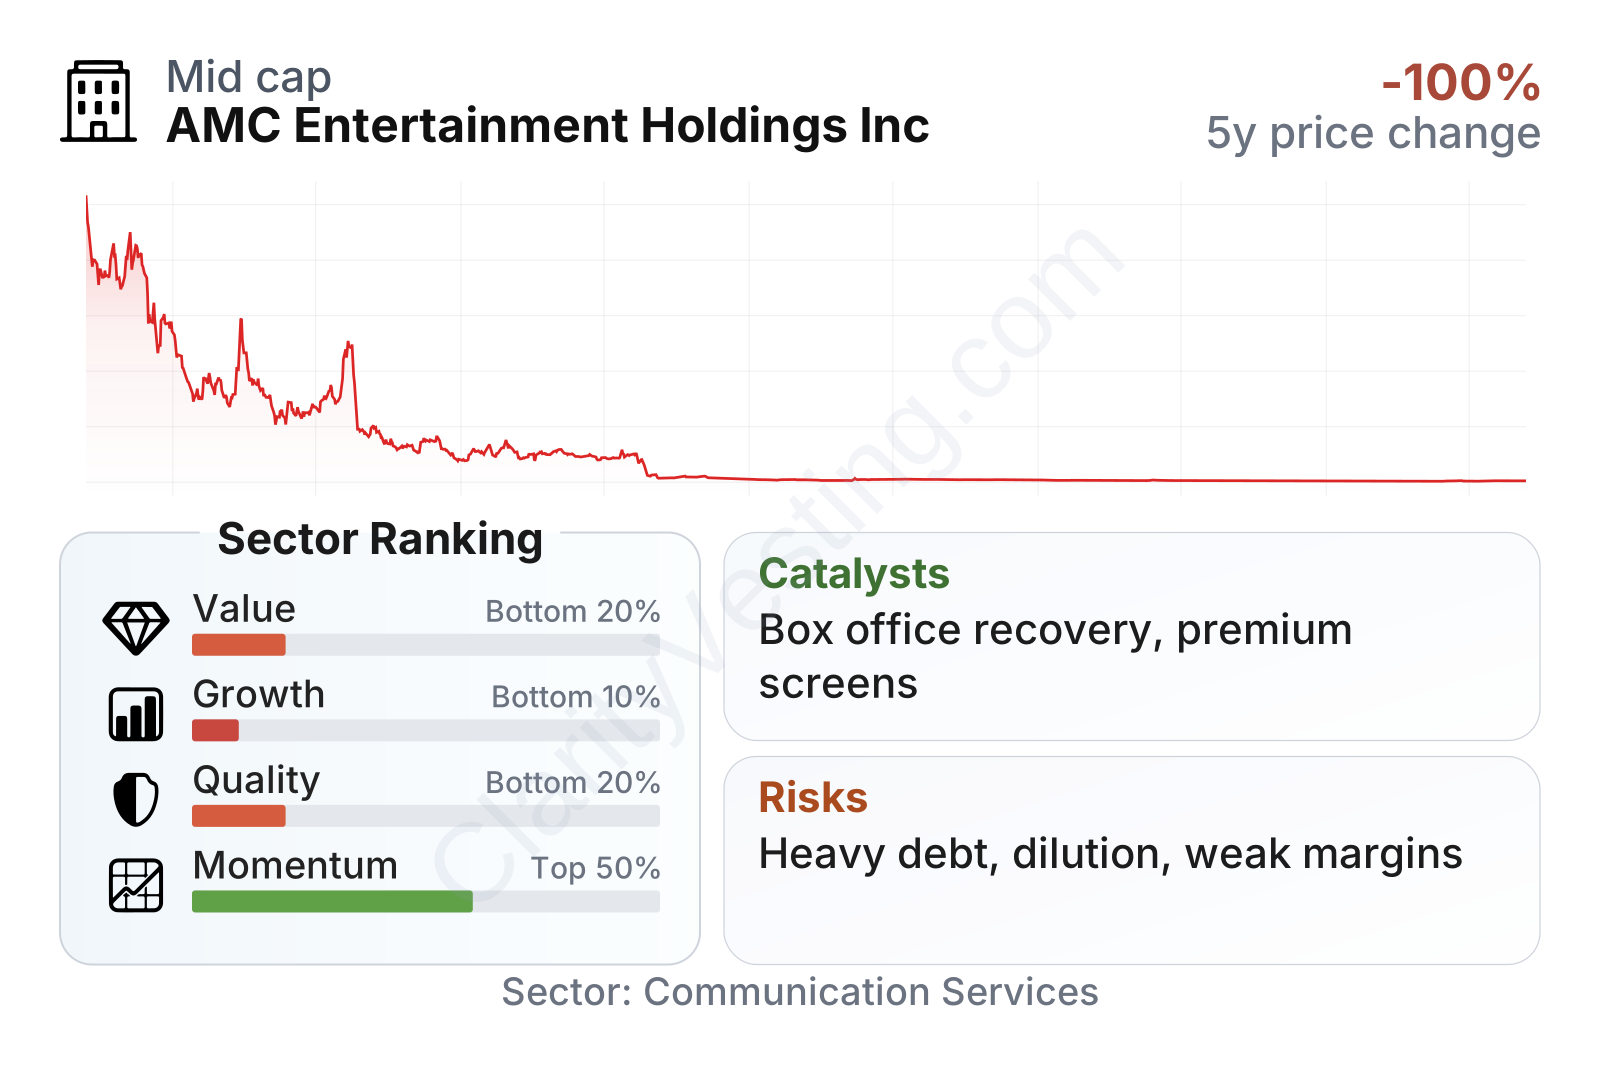
AMC’s profile is unusual. The company is small in market value relative to many large entertainment names, but its stock remains highly volatile, with a beta above 2. The share-price history also shows how far the stock has moved from the 2021 meme-stock peak, even after occasional rebounds. In the factor breakdown, AMC ranks weakly versus much of its sector on value, growth durability, and quality, mainly because cash generation is still negative, margins remain thin to negative, and debt pressure is extreme. One brighter point is that recent revenue growth has improved versus the sector median, but that near-term improvement sits next to much weaker five-year trends.

Growth

The movie exhibition industry is not a classic high-growth sector. It is better described as a mature entertainment business that can still produce growth when the film slate is strong, premium formats expand, and theaters increase spending per guest. In that sense, AMC’s opportunity is more about recovery, optimization, and selective expansion of higher-value experiences than about rapid structural growth.

AMC’s strategy for future growth is logical in operational terms. Management has focused on premium screens, better seating, food-and-beverage upgrades, loyalty membership, and pricing initiatives designed to raise revenue per patron. These moves make sense because theaters have limited room to expand attendance quickly, so improving the economics of each visit is important. The company has also highlighted alternative content and branded consumer products as ways to stretch the AMC name beyond ticket sales alone.

Revenue growth has been uneven, which is typical for a theater chain that depends on film releases, but the latest year-over-year pace shows that AMC can still post healthy rebounds when the box office schedule improves. The problem is consistency: over a longer period, revenue per share and earnings trends remain weak, showing that the business has not yet established a steady multi-year growth engine.

Free cash flow is one of the most important measures for a company like AMC because it shows whether the business is producing enough cash to support operations, maintain theaters, and manage debt. The recent direction is better than in prior years, with cash burn narrowing sharply from much deeper negative levels. That is a constructive sign. Still, cash flow remains negative, so the turnaround is incomplete rather than finished.

A meaningful catalyst for AMC is simply a healthier film pipeline. When major studios return to a fuller release schedule, attendance can recover quickly, especially for large franchise films and event-style releases. Premium formats such as IMAX and Dolby Cinema can amplify that effect because they usually support higher ticket prices and stronger concession spending. Another potential support is continued cost discipline: if AMC can hold operating expenses relatively flat while revenue improves, margins could recover faster than sales.

Recent company updates have also emphasized debt management, theater optimization, and selective capital actions to preserve liquidity. For long-term analysis, those steps matter more than short-lived trading excitement because they speak directly to whether AMC can stabilize the business and eventually convert box office recovery into sustainable cash generation.

Risks

The main risk is the balance sheet. AMC’s leverage remains far above sector norms, and some standard balance-sheet ratios are distorted by negative shareholder equity. In plain language, the company still carries a debt burden that is very heavy relative to its earnings power. That creates pressure from interest expense and reduces flexibility if the box office weakens again.

This chart should be read carefully because AMC’s negative equity makes the debt-to-equity ratio look unusual rather than merely high. Even so, the message is clear: the company’s capital structure is far more fragile than the sector median, and debt remains a central issue for the long-term outlook.

A second major risk is profitability. AMC has made progress from the worst pandemic years, but profit margins are still negative and well below the sector median. That means the company is still vulnerable to swings in attendance, film quality, labor costs, rent, and interest rates.

The long trend shows improvement from very large losses, but not a full return to healthy earnings. AMC is operating closer to break-even than before, yet the business has not shown a reliable cushion that would make downturns easier to absorb.

Competition is another challenge, though it is more nuanced than it first appears. AMC is a leader in scale among theater operators, particularly in the United States, and that scale provides some advantages in studio relationships, marketing reach, loyalty programs, and premium-format deployment. However, theaters do not enjoy especially strong competitive moats. Consumers can choose other chains, local cinemas, home streaming, gaming, live events, or simply other leisure activities. The biggest structural competitor is not just another theater chain; it is at-home entertainment.

Among traditional competitors, Cinemark is often viewed as a key benchmark in the U.S. market, while Cineplex is relevant in Canada and several regional operators compete in Europe. Compared with many peers, AMC has strong brand recognition and broad footprint, but it is also more burdened by debt and has had a more difficult path back to consistent profitability. Scale helps, but financial leverage weakens the advantage.

There is also shareholder dilution risk. AMC has repeatedly used equity issuance and related capital-market actions in recent years to shore up liquidity. Those moves can help the company survive and refinance, but they can also reduce the ownership value represented by each individual share over time. For a long-term view, that trade-off is important.

Another risk is reputational and governance complexity tied to AMC’s meme-stock status. The company has one of the most retail-driven shareholder bases in the market, which can create unusual volatility and make the stock trade on sentiment as much as fundamentals for long stretches. That does not directly damage theater operations, but it can complicate how the market values the business and how management communicates capital decisions.

Valuation

Valuing AMC with traditional tools is difficult because earnings remain negative on a trailing basis, which makes the usual price-to-earnings approach largely unhelpful.

The absence of a meaningful trailing P/E for much of the period is itself a signal: the company has not produced stable positive earnings in the way mature entertainment businesses typically do. That forces the valuation discussion toward enterprise value, cash flow recovery, debt load, and the possibility of future normalization rather than current earnings multiples.

On those measures, AMC does not look cheap in a conventional fundamental sense. The company sits in the bottom tier of its sector on value metrics, with negative free cash flow yield and earnings power that remains weak compared with enterprise value. A high PEG ratio also suggests the market is not pricing AMC as a straightforward distressed asset, even though its financial profile is still fragile.

The current price can only be justified if one assumes a continued rebound in box office demand, better per-patron spending, tighter cost control, and gradual improvement in financing pressure. In other words, the valuation leans heavily on recovery expectations rather than on already-established profitability. That makes the shares more dependent on execution and industry normalization than many larger entertainment businesses.

Conclusion

AMC remains a recognizable leader in movie exhibition with real scale, a large theater footprint, and a business model that can improve meaningfully when film releases are strong and customers keep spending on premium experiences and concessions. The company is no longer in the deepest crisis phase, and recent revenue momentum plus a sharp reduction in cash burn show that the operating recovery is real.

Even so, the long-term picture is still defined by financial strain. Heavy debt, negative net margins, negative free cash flow, and a history of dilution make AMC much more complex than a simple reopening or box office recovery case. The company’s strengths are operational and brand-based, but the constraints are balance-sheet driven.

Overall, AMC looks more like a high-uncertainty turnaround than a settled long-term compounder. The business has pathways to improve if the theatrical market remains healthy and management keeps tightening execution, but the valuation still asks the market to look past a balance sheet and profit profile that remain materially weaker than sector norms.

Sources:

  • AMC Entertainment Holdings, Inc. — Form 10-Q for the quarter ended March 31, 2026
  • AMC Entertainment Holdings, Inc. — Form 10-K for the year ended December 31, 2025
  • AMC Entertainment Holdings, Inc. — Investor Relations press releases and earnings presentation materials, 2026
  • U.S. Securities and Exchange Commission — EDGAR company filings for AMC Entertainment Holdings, Inc.
  • Wikipedia — AMC Theatres

This article is for informational purposes only and does not constitute financial advice. Some content is AI-generated. See Disclaimer


Sign up for exclusive research and insights.

Unsubscribe anytime.
