Stock Analysis · Balincan International Inc (ALTB)
Overview
Balincan International Inc operates in the auto and truck dealership space, but it does not look like a traditional large dealership group with an established nationwide footprint. Based on its public filings and reported financials, the company appears to be in an early and still unsettled operating phase, with a small revenue base compared with its stock market value and a business model that has not yet translated into steady profitability.
Revenue disclosure is limited, and the company’s recent filings do not provide the kind of detailed segment breakdown that larger public retailers usually offer. From the available numbers, Balincan’s revenue seems to come primarily from its core automotive-related operations, but the business remains very small in absolute terms. Because the company’s filings do not clearly separate sales streams in a reliable percentage format, a ranked revenue mix cannot be stated with confidence without overreaching beyond what is publicly documented.
What stands out more than the revenue mix is the structure of the income statement: reported revenue has remained modest, while operating expenses have been consistently far above sales. That means the current investment case depends less on proven business scale today and more on whether management can convert a small operating platform into something much larger over time.
The financial flow highlights a persistent gap between revenue and operating costs. Sales were minimal for several years, then improved, but overhead still absorbed more than gross profit and led to recurring net losses. That pattern suggests the business is still in a build-out or transition phase rather than a mature dealership operation.
Key Figures
| Metric | Value | Sector ⓘ |
|---|---|---|
| Date | Sep 12, 2026 | |
| Context | ||
| Sector | Consumer Cyclical | |
| Industry | Auto & Truck Dealerships | |
| Market Cap ⓘ | $9.96B | |
| Beta ⓘ | -1.06 | |
Value (Cheapness) | ||
| P/E Ratio ⓘ | N/A | 17.10 |
| FCF Yield ⓘ | -0.00% | 8.53% |
| EBIT / EV ⓘ | N/A | 6.46% |
| PEG ⓘ | N/A | |
Growth (Business expansion) | ||
| Revenue Growth ⓘ | N/A | 5.75% |
| RPS Growth (5Y CAGR) ⓘ | N/A | 9.14% |
| EPS Growth (5Y CAGR) ⓘ | N/A | -18.21% |
| Margin Growth (5Y Trend) ⓘ | N/A | -0.23% |
| FCF Growth (5Y CAGR) ⓘ | N/A | 4.91% |
Quality (Business durability) | ||
| ROIC (Latest) ⓘ | N/A | 12.61% |
| ROIC (5Y Median) ⓘ | N/A | 10.72% |
| Net Debt / EBIT (Latest) ⓘ | N/A | 2.10 |
| Net Debt / EBIT (5Y Median) ⓘ | N/A | 2.32 |
| Operating Margin (Latest) ⓘ | N/A | 9.25% |
| Operating Margin (5Y Median) ⓘ | N/A | 9.64% |
| Debt to Equity (Latest) ⓘ | N/A | 75.78% |
| Profit Margin (Latest) ⓘ | -20.70% | 5.33% |
| Free Cash Flow (Latest) ⓘ | -$33.23K | |
Momentum (Price trend) | ||
| 3Y Return ⓘ | +156.41% | +14.53% |
| 12M Return (excl. last month) ⓘ | +32.55% | +3.08% |
| 6M Return ⓘ | +85.19% | +0.55% |
| Price vs. 200-Day MA ⓘ | +34.62% | -0.54% |
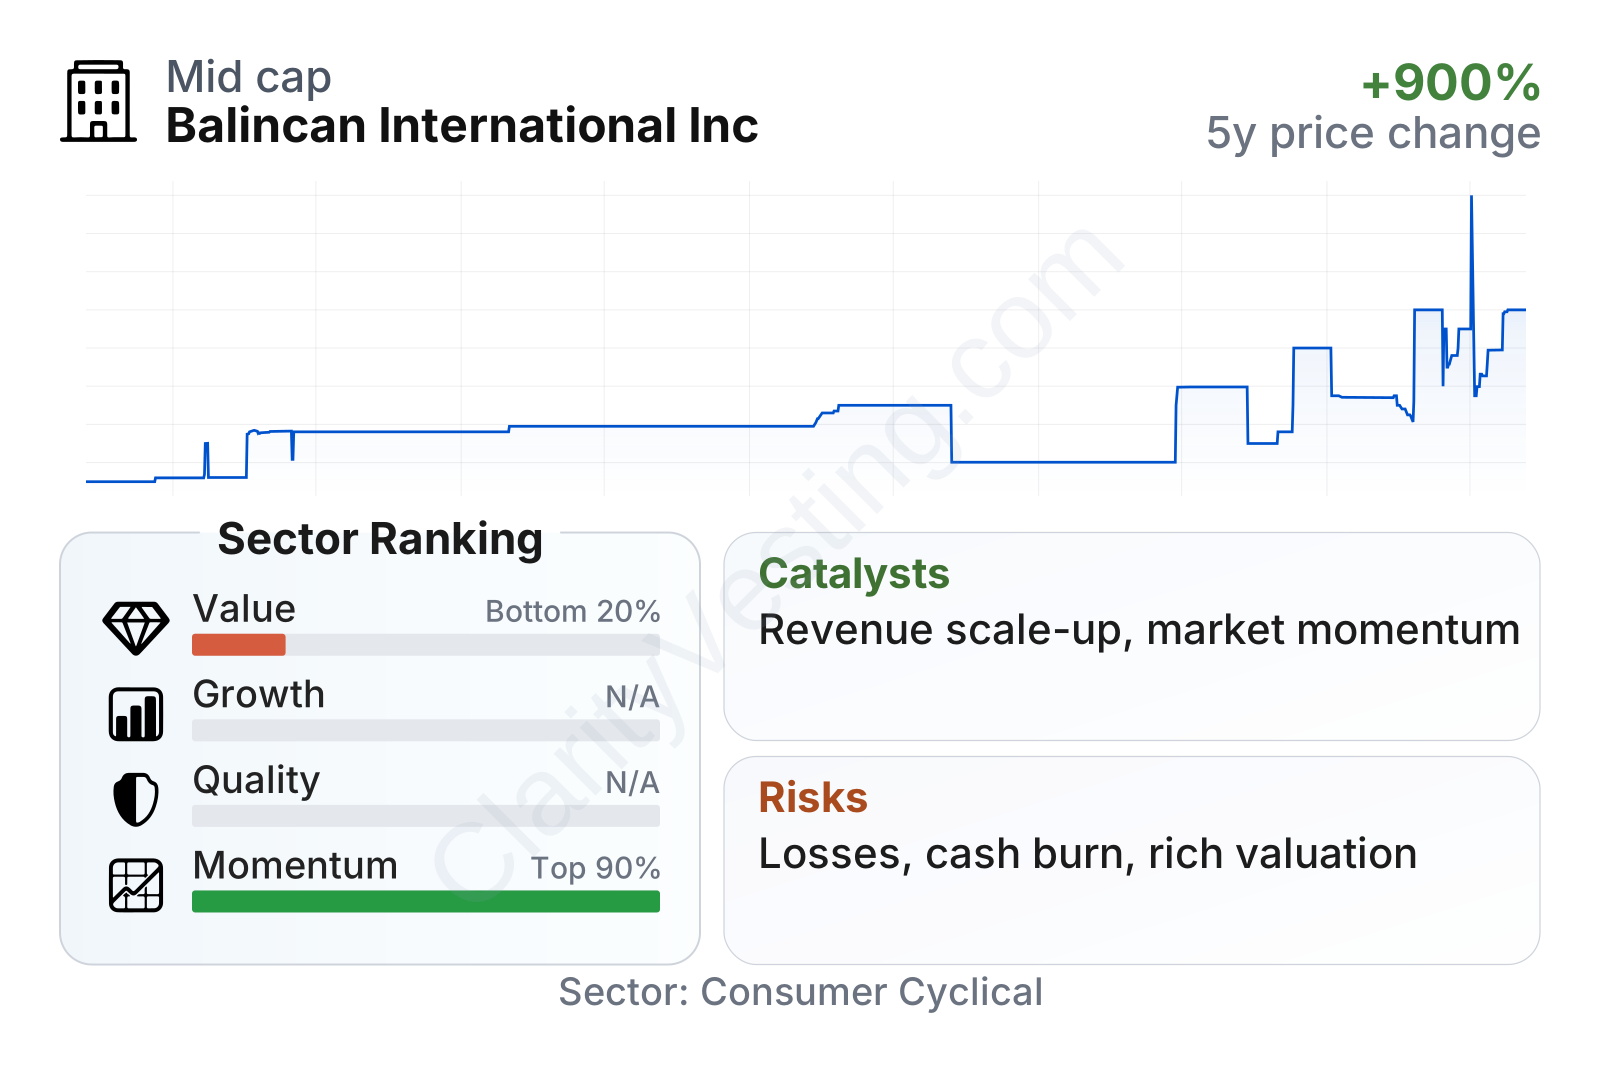
The market capitalization is unusually large relative to the company’s reported revenue and cash generation, which immediately makes the stock harder to assess using standard retail-sector benchmarks. On the positive side, share-price momentum has been very strong versus much of the consumer cyclical universe over the past year and over multi-year periods. On the negative side, valuation and cash-flow metrics screen very weakly, with negative free cash flow and no meaningful earnings multiple because the company is loss-making. In short, the market performance has been strong, but the operating fundamentals remain fragile.
Growth
The broader sector is not a classic high-growth industry. Auto and truck dealerships usually grow through scale, inventory turnover, location expansion, financing, service, and acquisition execution rather than through the kind of rapid structural growth seen in software or semiconductors. That makes Balincan’s profile unusual: its potential upside would need to come from company-specific execution, not from a fast-growing industry lifting all participants.
Revenue trends have been highly volatile. After very weak comparisons in 2024, the company posted bursts of extremely rapid year-over-year growth in several 2025 periods, followed by another contraction in the latest quarter shown. That kind of pattern can happen when a company is starting from a very small base, adds or loses specific commercial activity, or changes the scope of operations. It can point to opportunity, but it does not yet show a stable upward trajectory.
The revenue chart suggests headline growth rates should be treated carefully. Some quarters show explosive percentage gains, but those jumps are coming off a very limited revenue base and have not yet produced consistent scale. For long-term analysis, the more important question is whether the company can turn sporadic growth into durable and repeatable sales.
Cash generation tells a similarly mixed story. There was a brief improvement when free cash flow turned positive, but the latest trailing figure is back below zero. For a small company trying to expand, that matters because growth funded by recurring cash burn is much more difficult to sustain than growth supported by internal cash generation.
The cash-flow pattern points to an operation that has not yet reached self-funding status. Unless revenue expands materially or costs are brought under tighter control, future growth could remain dependent on outside capital, which tends to raise the execution bar.
As for catalysts, the most significant one is straightforward: the company’s public valuation already implies expectations for a much larger business than current revenue reflects. If management can demonstrate a credible step-up in operating scale, the market may continue to focus on that expansion potential. However, no major publicly documented 2026 catalyst from trusted primary sources stands out as a clearly transformative event on its own; the main catalyst remains operational progress itself rather than a single headline announcement.
Risks
This article is for informational purposes only and does not constitute financial advice. Some content is AI-generated. See Disclaimer


