Stock Analysis · Allison Transmission Holdings Inc (ALSN)
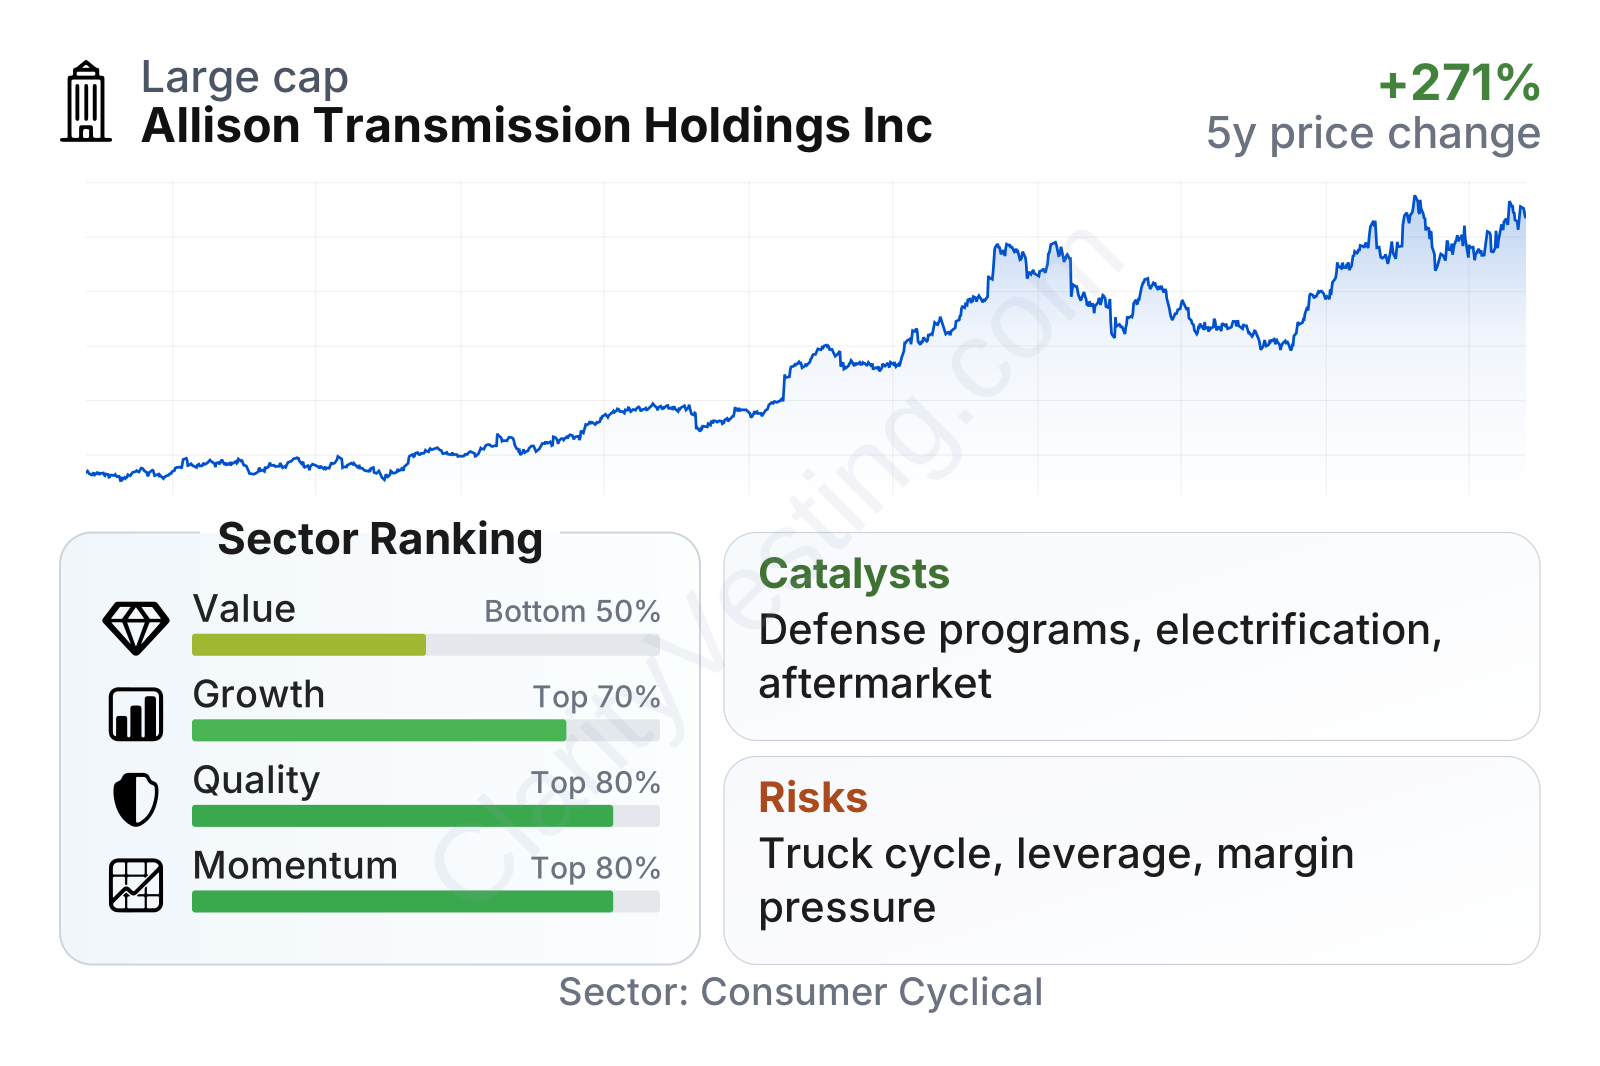
Overview
Allison Transmission Holdings Inc. designs and manufactures propulsion solutions used mainly in commercial and defense vehicles. The company is best known for fully automatic transmissions for medium- and heavy-duty trucks, buses, motorhomes, off-highway equipment, and military vehicles. It also sells electrified propulsion systems and related vehicle software, controls, and connected services. In simple terms, Allison makes the systems that help large vehicles move, shift power efficiently, and operate reliably in demanding conditions.
Its business is centered on original equipment manufacturers, or OEMs, that install Allison products in new vehicles, and on aftermarket customers that buy replacement parts, service components, support equipment, and remanufactured products over the life of the vehicle. That creates a mix of cyclical new-vehicle demand and steadier recurring revenue from vehicles already on the road.
The latest annual filing shows revenue split mainly between North America and international markets, with North America still dominant. Based on the company’s recent reporting structure, the main revenue sources can be summarized as follows:
- North America On-Highway: approximately 65% to 70% of revenue. This includes transmissions and propulsion systems for medium- and heavy-duty trucks, school buses, transit buses, motorhomes, and other commercial vehicles.
- Global Off-Highway: approximately 10% to 15%. This covers construction, mining, energy, and other industrial equipment.
- Service Parts, Support Equipment, and Other: approximately 10% to 15%. This includes replacement parts, remanufactured products, support tools, and other aftermarket activity.
- Outside North America On-Highway: approximately 5% to 10%. This includes commercial vehicle applications in regions such as Europe, Asia, and South America.
- Defense: approximately 5% to 10%. This includes propulsion products for tracked and wheeled military vehicles.
One notable feature of Allison’s model is profitability discipline. Over the last several years, revenue rose from roughly $2.4 billion in 2021 to more than $3.2 billion in 2024 before easing back near $3.0 billion in 2025, while operating income and net income remained strong. Interest expense also declined meaningfully from 2021 to 2024, showing the benefit of earlier deleveraging even though leverage increased again more recently.
The broad picture is a company with a specialized product line, meaningful recurring aftermarket activity, and unusually high margins for the auto parts space.
Key Figures
| Metric | Value | Sector ⓘ |
|---|---|---|
| Date | Sep 12, 2026 | |
| Context | ||
| Sector | Consumer Cyclical | |
| Industry | Auto Parts | |
| Market Cap ⓘ | $10.53B | |
| Beta ⓘ | 0.97 | |
Value (Cheapness) | ||
| P/E Ratio ⓘ | 20.28 | 17.10 |
| FCF Yield ⓘ | 6.94% | 8.53% |
| EBIT / EV ⓘ | 6.09% | 6.46% |
| PEG ⓘ | 0.59 | |
Growth (Business expansion) | ||
| Revenue Growth ⓘ | 92.40% | 5.75% |
| RPS Growth (5Y CAGR) ⓘ | 12.07% | 9.14% |
| EPS Growth (5Y CAGR) ⓘ | -3.53% | -18.21% |
| Margin Growth (5Y Trend) ⓘ | 1.32% | -0.23% |
| FCF Growth (5Y CAGR) ⓘ | 8.99% | 4.91% |
Quality (Business durability) | ||
| ROIC (Latest) ⓘ | 12.66% | 12.61% |
| ROIC (5Y Median) ⓘ | 24.52% | 10.72% |
| Net Debt / EBIT (Latest) ⓘ | 4.27 | 2.10 |
| Net Debt / EBIT (5Y Median) ⓘ | 2.10 | 2.32 |
| Operating Margin (Latest) ⓘ | 23.54% | 9.25% |
| Operating Margin (5Y Median) ⓘ | 29.97% | 9.64% |
| Debt to Equity (Latest) ⓘ | 207.88% | 75.78% |
| Profit Margin (Latest) ⓘ | 12.02% | 5.33% |
| Free Cash Flow (Latest) ⓘ | $731.00M | |
Momentum (Price trend) | ||
| 3Y Return ⓘ | +120.97% | +14.53% |
| 12M Return (excl. last month) ⓘ | +37.00% | +3.08% |
| 6M Return ⓘ | +12.76% | +0.55% |
| Price vs. 200-Day MA ⓘ | +10.16% | -0.54% |
Allison stands out on quality and market performance more than on classic value screens. Profitability is well above the sector median, with operating margins in the low-20% range versus a much lower industry norm, and long-run returns on invested capital have also been strong. Growth metrics look better than much of the sector over a multiyear period, especially for revenue per share and free cash flow, although the most recent earnings profile is less smooth than the stock chart suggests. On valuation, the shares no longer look as discounted as they did a few years ago, and the current earnings multiple sits around or slightly above the sector median. The company remains mid-sized, and its beta near 1 suggests price swings broadly in line with the market rather than extreme volatility.
Growth
Allison operates in a sector that is not usually described as a high-growth corner of the market, but it does have durable demand drivers. Commercial vehicles need dependable transmissions and propulsion systems, fleets continue to replace aging equipment, defense spending can support military vehicle programs, and off-highway machinery remains tied to construction, mining, and infrastructure activity. These are practical end markets rather than speculative ones, which can support long-term compounding when a company has a strong niche.
The company’s strategy for future growth is reasonably clear. Allison has been expanding beyond its historical core in North American automatic transmissions by adding electrified propulsion products, axles, and wider commercial-duty applications. Acquisitions in recent years have also aimed to broaden the powertrain offering and increase content per vehicle. That matters because a company that sells more components into each platform can grow even if industry unit volumes are only moderate.
Revenue growth has not been perfectly linear. The business showed healthy expansion through 2024, followed by a softer 2025, then a sharp rebound in early 2026 on a year-over-year basis. That pattern suggests Allison is still exposed to ordering cycles and comparisons, but it also shows the company can recover quickly when end markets improve or program timing shifts. Over five years, revenue per share growth has outpaced the sector median, which is a better long-term sign than any single quarter.
Free cash flow is one of the most important strengths here. It has held around the mid-hundreds of millions of dollars and trended upward from 2022 levels, showing that accounting profit is being converted into real cash. For a manufacturer serving cyclical industries, that is an important sign of operating resilience. Strong cash generation gives management flexibility for dividends, share repurchases, debt management, and selective acquisitions.
A meaningful catalyst is the continued shift toward more sophisticated propulsion systems in commercial vehicles. Allison’s installed base, engineering know-how, and long customer relationships can help it participate in upgrades such as fuel-efficiency improvements, alternative propulsion architectures, and defense vehicle modernization. Recent company communications have also pointed to ongoing demand in vocational trucks, defense programs, and international expansion opportunities, all of which can widen the addressable market beyond its traditional core.
Risks
This article is for informational purposes only and does not constitute financial advice. Some content is AI-generated. See Disclaimer


