Stock Analysis · Airbnb Inc (ABNB)
Overview
Airbnb operates a global online marketplace for travel accommodations and experiences. In simple terms, it connects guests looking for a place to stay or an activity to book with hosts offering homes, rooms, or local experiences. The platform does not own most of the properties listed on it, which makes the business more asset-light than a traditional hotel company. Its reach is broad, spanning city apartments, vacation homes, rural cabins, and longer-term stays, with demand coming from leisure travelers, families, remote workers, and increasingly from international cross-border travel.
Airbnb’s revenue is heavily concentrated in booking-related fees. Based on company filings, substantially all revenue comes from service fees generated when a reservation is made on the platform, with a much smaller contribution from other activities such as experiences and ancillary offerings. A practical way to read the business is the following:
- Guest and host booking fees: approximately 95%+ — service fees tied to nights and experiences booked through the platform. This is the economic core of Airbnb.
- Experiences and other revenue: likely below 5% — includes non-accommodation offerings and smaller adjacent activities. This remains secondary relative to stays.
What stands out in Airbnb’s model is the combination of strong gross profit, limited balance-sheet intensity, and a global brand that can attract both travelers and hosts. That structure has allowed revenue to scale from about $6.0 billion in 2021 to about $12.3 billion in 2025, while operating income and net income moved from modest or negative levels into clearly profitable territory. One notable point, however, is that 2025 showed a jump in cost of revenue, which suggests the company is spending more to support growth, product expansion, or payment and platform operations than it did in 2024.
Key Figures
| Metric | Value | Sector ⓘ |
|---|---|---|
| Date | Sep 12, 2026 | |
| Context | ||
| Sector | Consumer Cyclical | |
| Industry | Travel Services | |
| Market Cap ⓘ | $101.91B | |
| Beta ⓘ | 1.16 | |
Value (Cheapness) | ||
| P/E Ratio ⓘ | 38.33 | 17.10 |
| FCF Yield ⓘ | 4.78% | 8.53% |
| EBIT / EV ⓘ | 3.28% | 6.46% |
| PEG ⓘ | 1.59 | |
Growth (Business expansion) | ||
| Revenue Growth ⓘ | 16.50% | 5.75% |
| RPS Growth (5Y CAGR) ⓘ | 19.37% | 9.14% |
| EPS Growth (5Y CAGR) ⓘ | -14.34% | -18.21% |
| Margin Growth (5Y Trend) ⓘ | 18.90% | -0.23% |
| FCF Growth (5Y CAGR) ⓘ | 19.05% | 4.91% |
Quality (Business durability) | ||
| ROIC (Latest) ⓘ | 22.99% | 12.61% |
| ROIC (5Y Median) ⓘ | 25.16% | 10.72% |
| Net Debt / EBIT (Latest) ⓘ | -1.48 | 2.10 |
| Net Debt / EBIT (5Y Median) ⓘ | -2.09 | 2.32 |
| Operating Margin (Latest) ⓘ | 22.22% | 9.25% |
| Operating Margin (5Y Median) ⓘ | 22.03% | 9.64% |
| Debt to Equity (Latest) ⓘ | 32.00% | 75.78% |
| Profit Margin (Latest) ⓘ | 20.45% | 5.33% |
| Free Cash Flow (Latest) ⓘ | $4.87B | |
Momentum (Price trend) | ||
| 3Y Return ⓘ | +15.38% | +14.53% |
| 12M Return (excl. last month) ⓘ | +48.09% | +3.08% |
| 6M Return ⓘ | +33.27% | +0.55% |
| Price vs. 200-Day MA ⓘ | +21.10% | -0.54% |
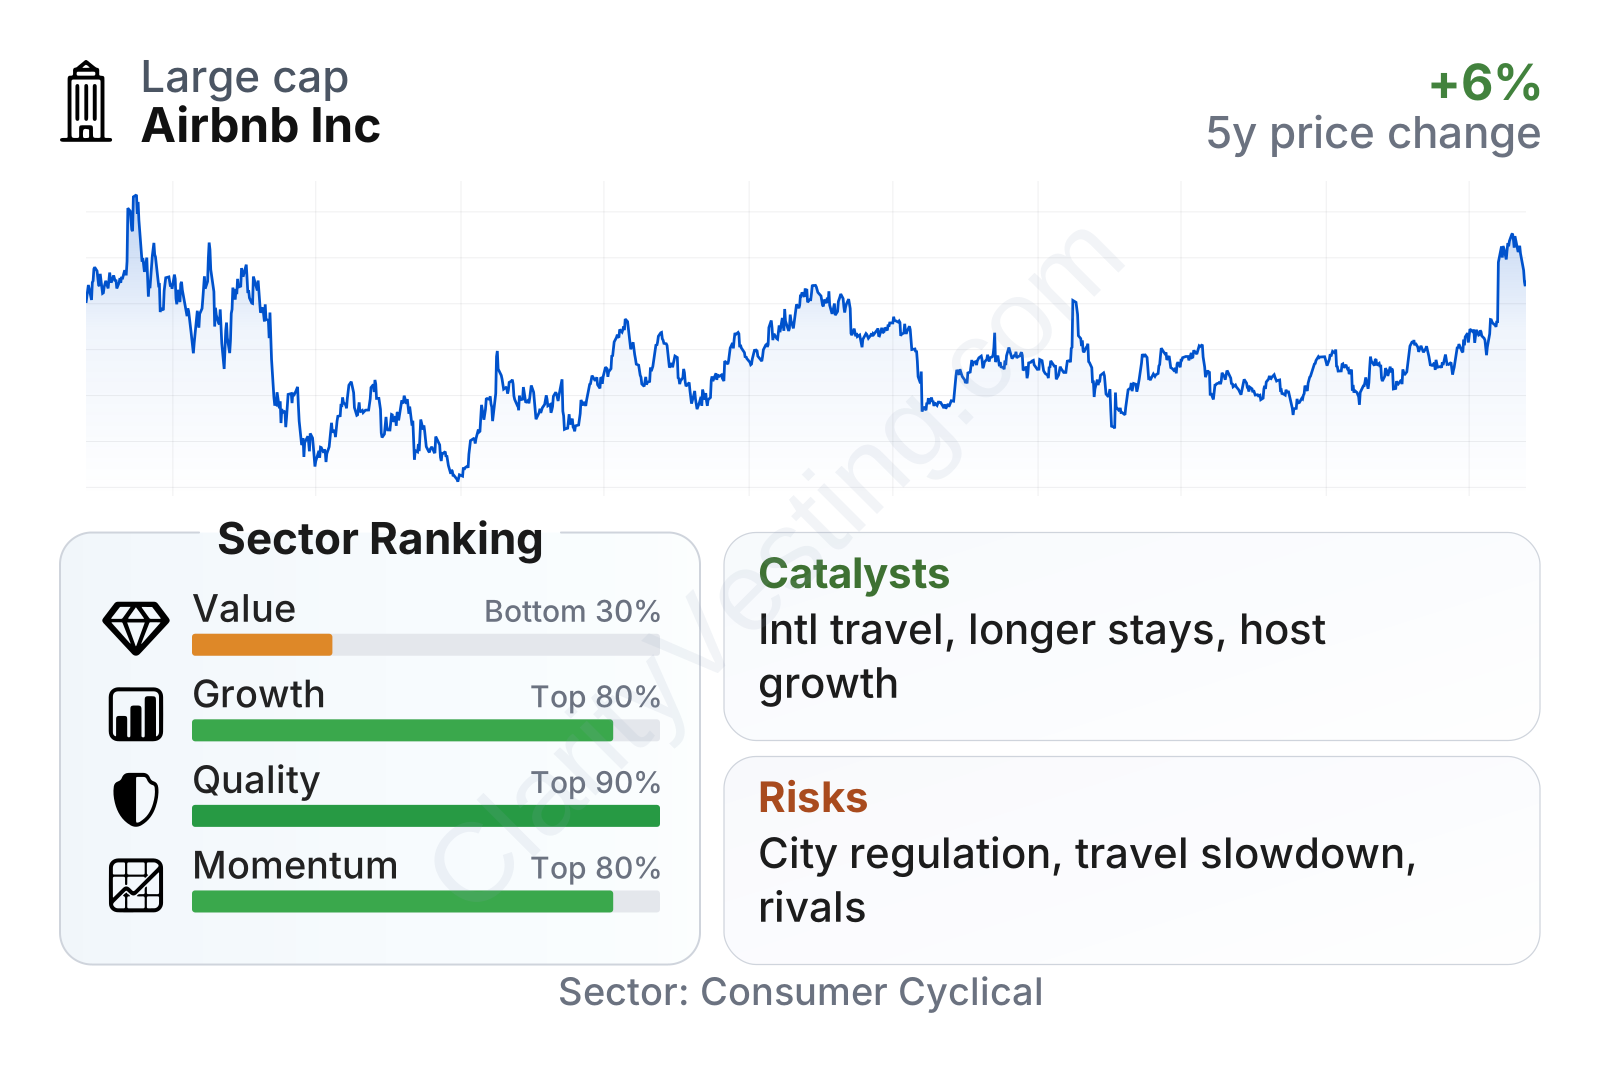
Airbnb is now a very large travel platform by market value, with share-price behavior that has been more volatile than the broad market but still within a normal range for a well-known internet consumer brand. The overall profile is unusual in a positive way: quality metrics are strong, growth metrics are also strong relative to much of the sector, and momentum has been favorable. The weaker area is valuation, where the stock trades above sector norms on earnings and cash-flow-based measures. In other words, the business looks financially strong, but the market is already recognizing much of that strength.
Growth
Airbnb operates in a travel market that still has room to expand over the long run. Global travel demand continues to benefit from rising cross-border mobility, flexible work, and consumer preference for alternative accommodations beyond traditional hotels. Airbnb is particularly well placed for trips that are longer, more local, more group-oriented, or outside major hotel corridors. That matters because those categories are not just cyclical rebounds; they reflect lasting shifts in how many people travel.
Its strategy also makes sense for future growth. The company continues to focus on expanding supply, improving search and discovery, making hosting easier, and increasing reliability and quality on the platform. That is important because the marketplace becomes stronger when more hosts join, more listings are available, and guests trust the booking experience. This network effect is one of Airbnb’s central economic strengths.
Revenue growth has slowed from the extraordinary rebound period after the pandemic, which is normal, but it remains healthy. Recent year-over-year growth has stayed in the low-to-mid teens, well above the sector median near mid-single digits. Over a five-year view, revenue per share has compounded at roughly 19%, showing that expansion has not been a one-quarter phenomenon.
Cash generation is another major growth support. Trailing free cash flow has climbed from roughly $2.9 billion in early 2022 to about $4.5 billion by early 2026, and the latest trailing figure in the broader metrics set is close to $4.9 billion. That gives Airbnb flexibility to invest in product development, international expansion, host tools, and new categories without relying heavily on debt.
A meaningful catalyst is Airbnb’s push beyond its original use case of short leisure stays. The company has continued to promote longer stays, international travel, and product updates designed to make the platform more useful across more trip types. In 2025 and 2026, management also emphasized product expansion and improvements intended to increase repeat usage. If Airbnb succeeds in becoming a broader travel platform rather than mainly a vacation-rental booking site, that could widen its addressable market materially.
Risks
This article is for informational purposes only and does not constitute financial advice. Some content is AI-generated. See Disclaimer


