Stock Analysis · Asbury Automotive Group Inc (ABG)
Overview
Asbury Automotive Group is one of the larger U.S. automotive retail companies. It operates franchised dealerships that sell new and used vehicles, arrange financing and insurance products, provide maintenance and repair services, and sell parts. The company also has a sizable presence in vehicle collision repair through its Total Care Auto, Powered by Landcar business, and it has been investing in digital retail tools to make buying and servicing cars easier across its store network.
Its business model is straightforward: vehicle sales generate most of the revenue, while service, parts, finance and insurance, and related offerings usually contribute a larger share of profit than their revenue share. Based on recent company filings, revenue is mainly divided as follows:
- New vehicle retail sales: approximately 53% of revenue. This is the sale of new cars and trucks through franchised dealerships.
- Used vehicle retail sales: approximately 28% of revenue. This includes the sale of pre-owned vehicles to retail customers.
- Parts and service: approximately 11% of revenue. This covers maintenance, repairs, warranty work, and replacement parts.
- Finance and insurance: approximately 5% of revenue. This includes arranging loans, leases, protection products, and related dealer services.
- Wholesale and other: approximately 3% of revenue. This usually includes vehicle sales to other dealers and miscellaneous dealership activities.
That revenue mix matters because auto retail is not only about selling cars. New and used vehicle sales drive volume, but fixed operations such as service and parts tend to be steadier and often more resilient during softer vehicle demand periods.
The overall pattern shows a company that expanded revenue materially from 2021 through 2025, but with profitability under pressure after the unusually strong conditions of 2022. Gross profit remains substantial, yet higher operating costs and interest expense have taken a larger share of the business than they did at the cycle peak.
Key Figures
| Metric | Value | Sector ⓘ |
|---|---|---|
| Date | Sep 12, 2026 | |
| Context | ||
| Sector | Consumer Cyclical | |
| Industry | Auto & Truck Dealerships | |
| Market Cap ⓘ | $3.75B | |
| Beta ⓘ | 0.71 | |
Value (Cheapness) | ||
| P/E Ratio ⓘ | 7.91 | 17.10 |
| FCF Yield ⓘ | 13.24% | 8.53% |
| EBIT / EV ⓘ | 10.51% | 6.46% |
| PEG ⓘ | 0.53 | |
Growth (Business expansion) | ||
| Revenue Growth ⓘ | 0.30% | 5.75% |
| RPS Growth (5Y CAGR) ⓘ | 17.19% | 9.14% |
| EPS Growth (5Y CAGR) ⓘ | -27.58% | -18.21% |
| Margin Growth (5Y Trend) ⓘ | -2.90% | -0.23% |
| FCF Growth (5Y CAGR) ⓘ | -14.80% | 4.91% |
Quality (Business durability) | ||
| ROIC (Latest) ⓘ | 8.29% | 12.61% |
| ROIC (5Y Median) ⓘ | 9.81% | 10.72% |
| Net Debt / EBIT (Latest) ⓘ | 5.62 | 2.10 |
| Net Debt / EBIT (5Y Median) ⓘ | 5.62 | 2.32 |
| Operating Margin (Latest) ⓘ | 5.44% | 9.25% |
| Operating Margin (5Y Median) ⓘ | 6.53% | 9.64% |
| Debt to Equity (Latest) ⓘ | 140.97% | 75.78% |
| Profit Margin (Latest) ⓘ | 2.83% | 5.33% |
| Free Cash Flow (Latest) ⓘ | $496.30M | |
Momentum (Price trend) | ||
| 3Y Return ⓘ | -6.34% | +14.53% |
| 12M Return (excl. last month) ⓘ | -10.55% | +3.08% |
| 6M Return ⓘ | +6.00% | +0.55% |
| Price vs. 200-Day MA ⓘ | -2.80% | -0.54% |
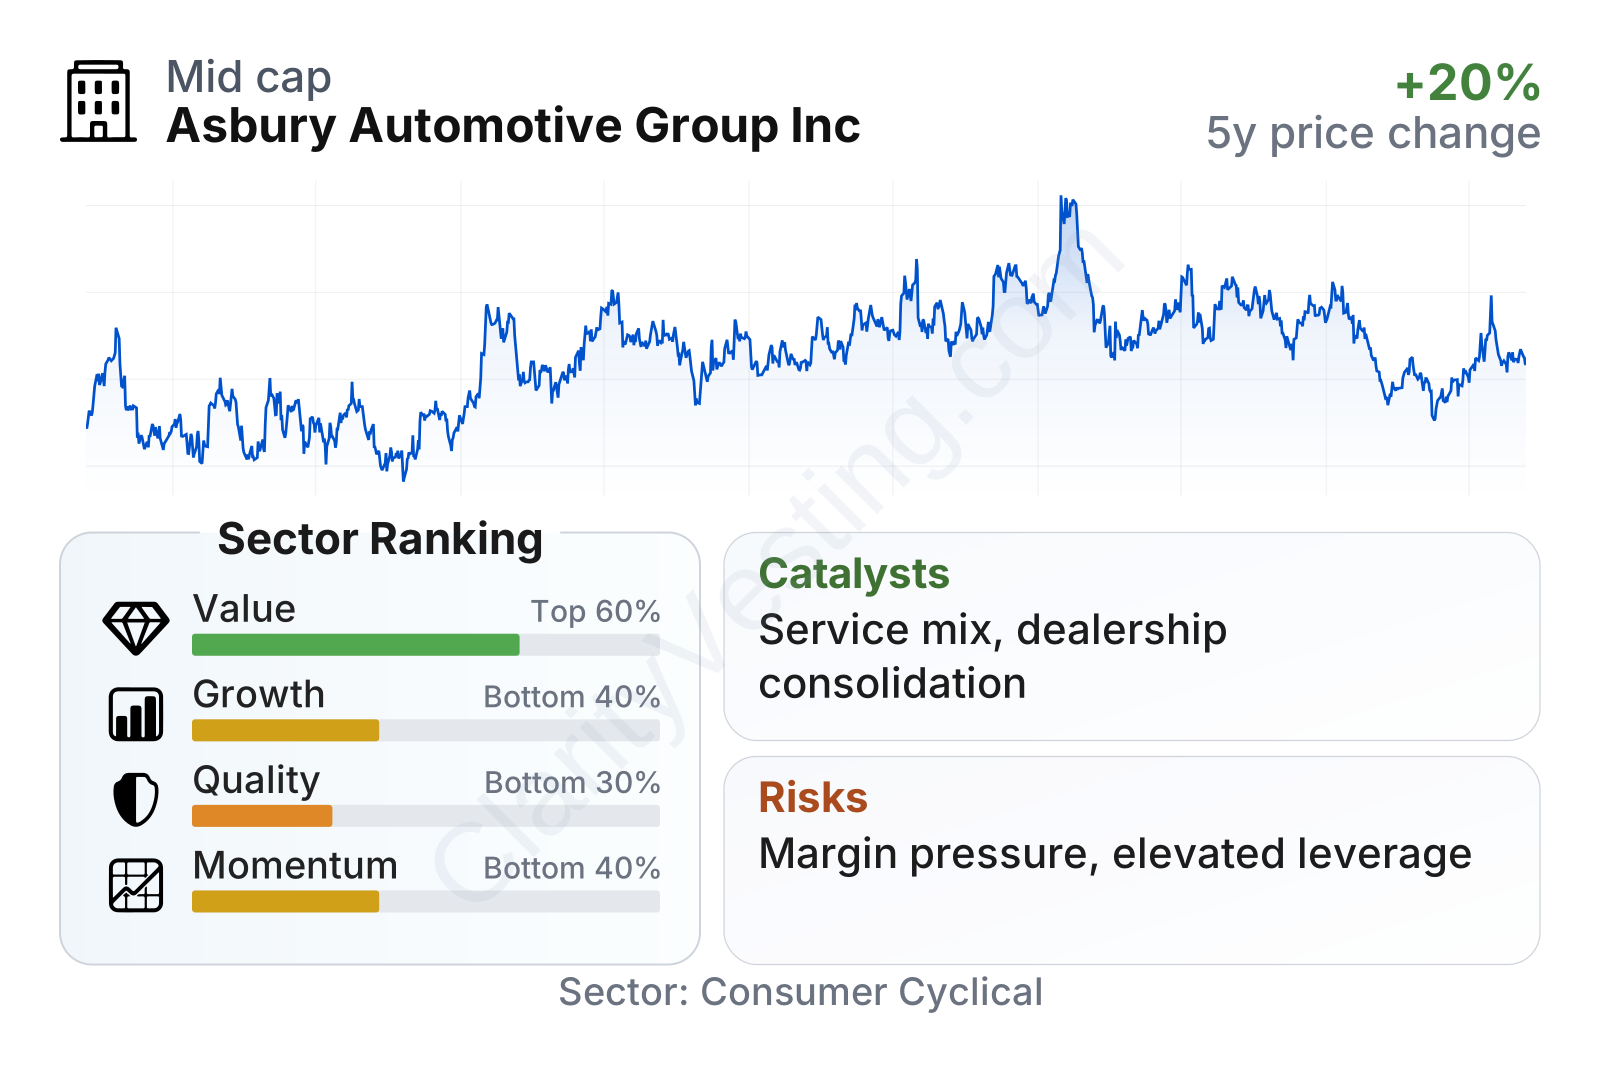
Asbury is a mid-sized public company within the consumer cyclical sector. The stock’s volatility has been relatively moderate, with a beta below 1. On valuation measures, the company screens cheaper than much of its sector: its earnings multiple is well below the sector median, while cash-flow-based measures also look stronger than average. At the same time, the table points to a less favorable picture on growth, profitability, and recent market performance. In simple terms, the market appears to be assigning a discounted valuation because the business is generating solid cash but not showing especially strong near-term growth or margins compared with peers.
Growth
Auto retail is a mature industry, but it is still supported by large and recurring demand. Americans continue to need transportation, the average age of vehicles on the road remains elevated by historical standards, and dealership service work benefits from that aging vehicle base. That does not make the sector a rapid-growth market, but it does provide a durable base of demand over long periods.
Asbury’s strategy for growth has centered on acquisitions, scale, and diversification beyond pure vehicle sales. In recent years, the company expanded through dealership purchases and added more exposure to higher-margin activities such as finance and insurance, service and parts, and vehicle protection products. This approach makes strategic sense for a cyclical industry because it adds recurring revenue streams that are less dependent on monthly new-vehicle sales swings.
Recent revenue growth has slowed sharply versus the post-pandemic surge. After extremely strong expansion in 2021 and 2022, growth turned uneven in 2023, improved during much of 2024 and parts of 2025, and then moved close to flat in the latest period. That suggests Asbury is now operating in a more normal market where volume growth is harder to achieve and pricing is less favorable than it was during the supply-constrained boom.
Cash generation is an important offset to that slower top-line growth. Free cash flow fell significantly from the peak levels seen earlier in the cycle, but it has recovered meaningfully from the low point. That recovery matters because dealership groups often use cash flow to fund acquisitions, reduce debt, repurchase shares, and reinvest in store upgrades and technology.
One notable catalyst is the long-term opportunity to capture a larger share of after-sale customer spending. Service, repair, collision work, and vehicle protection plans can deepen customer relationships and make earnings less reliant on new-car margins. Another favorable element is industry consolidation: the U.S. dealership market is still fragmented, which leaves room for large operators like Asbury to keep gaining scale if acquisition conditions remain attractive.
Recent company communications have also highlighted continued investment in omnichannel retailing and operating efficiency. That is not a dramatic breakthrough on its own, but over time it can improve inventory management, customer retention, and store-level productivity.
Risks
This article is for informational purposes only and does not constitute financial advice. Some content is AI-generated. See Disclaimer


