Stock Analysis · Apple Inc (AAPL)
Overview
Apple is a global technology company best known for the iPhone, but its business is much broader than smartphones. It designs consumer devices, develops operating systems and software, runs a large digital services ecosystem, and sells subscriptions, payment services, advertising, support plans, and accessories. Its strategy is built around a tightly connected ecosystem: customers who use one Apple product often end up using several, which helps the company keep demand stable and pricing strong over time.
Revenue is still led by hardware, especially the iPhone, but services have become a major profit engine. Based on Apple’s latest annual reporting, the revenue mix is approximately:
- iPhone: about 51% of revenue. This includes Apple’s flagship smartphones and remains the company’s largest business by a wide margin.
- Services: about 25%. This includes the App Store, advertising, AppleCare, cloud services, digital content, payment-related services, and subscription offerings such as Apple Music, TV+, Arcade, Fitness+, and iCloud.
- Wearables, Home and Accessories: about 10%. This includes Apple Watch, AirPods, Beats products, and home devices.
- Mac: about 8%. This covers Mac desktops and laptops.
- iPad: about 6%. This includes Apple’s tablet lineup.
Geographically, Apple is also diversified, with the Americas as the largest region, followed by Europe, Greater China, Japan, and the rest of Asia Pacific. That said, the business still depends heavily on a few very large product lines and on global consumer spending trends.
The long-term financial picture remains notable for scale and efficiency. Over the last several years, revenue has generally stayed in a very high range, while gross profit and operating income have expanded faster than many peers. Research and development spending has also risen steadily, showing that Apple is investing heavily while still keeping unusually strong profitability for a hardware company.
What stands out most is not just size, but operating discipline: revenue has grown from roughly the mid-$300 billions to above $400 billion in recent years, while gross profit has climbed faster than costs. At the same time, research and development spending has increased materially, suggesting Apple is defending its ecosystem without giving up its margin structure.
Key Figures
| Metric | Value | Sector ⓘ |
|---|---|---|
| Date | Sep 12, 2026 | |
| Context | ||
| Sector | Technology | |
| Industry | Consumer Electronics | |
| Market Cap ⓘ | $4.85T | |
| Beta ⓘ | 1.08 | |
Value (Cheapness) | ||
| P/E Ratio ⓘ | 37.46 | 29.51 |
| FCF Yield ⓘ | 2.82% | 4.25% |
| EBIT / EV ⓘ | 3.24% | 2.85% |
| PEG ⓘ | 2.48 | |
Growth (Business expansion) | ||
| Revenue Growth ⓘ | 16.40% | 15.40% |
| RPS Growth (5Y CAGR) ⓘ | 6.34% | 8.56% |
| EPS Growth (5Y CAGR) ⓘ | 3.18% | -11.88% |
| Margin Growth (5Y Trend) ⓘ | 1.32% | 0.46% |
| FCF Growth (5Y CAGR) ⓘ | 1.53% | 9.80% |
Quality (Business durability) | ||
| ROIC (Latest) ⓘ | 69.84% | 9.44% |
| ROIC (5Y Median) ⓘ | 55.83% | 8.30% |
| Net Debt / EBIT (Latest) ⓘ | 0.29 | 0.54 |
| Net Debt / EBIT (5Y Median) ⓘ | 0.72 | 0.44 |
| Operating Margin (Latest) ⓘ | 33.21% | 9.58% |
| Operating Margin (5Y Median) ⓘ | 30.58% | 8.25% |
| Debt to Equity (Latest) ⓘ | 78.41% | 33.33% |
| Profit Margin (Latest) ⓘ | 27.62% | 7.14% |
| Free Cash Flow (Latest) ⓘ | $136.68B | |
Momentum (Price trend) | ||
| 3Y Return ⓘ | +91.02% | +45.48% |
| 12M Return (excl. last month) ⓘ | +32.10% | +23.48% |
| 6M Return ⓘ | +30.15% | +20.93% |
| Price vs. 200-Day MA ⓘ | +16.78% | +7.43% |
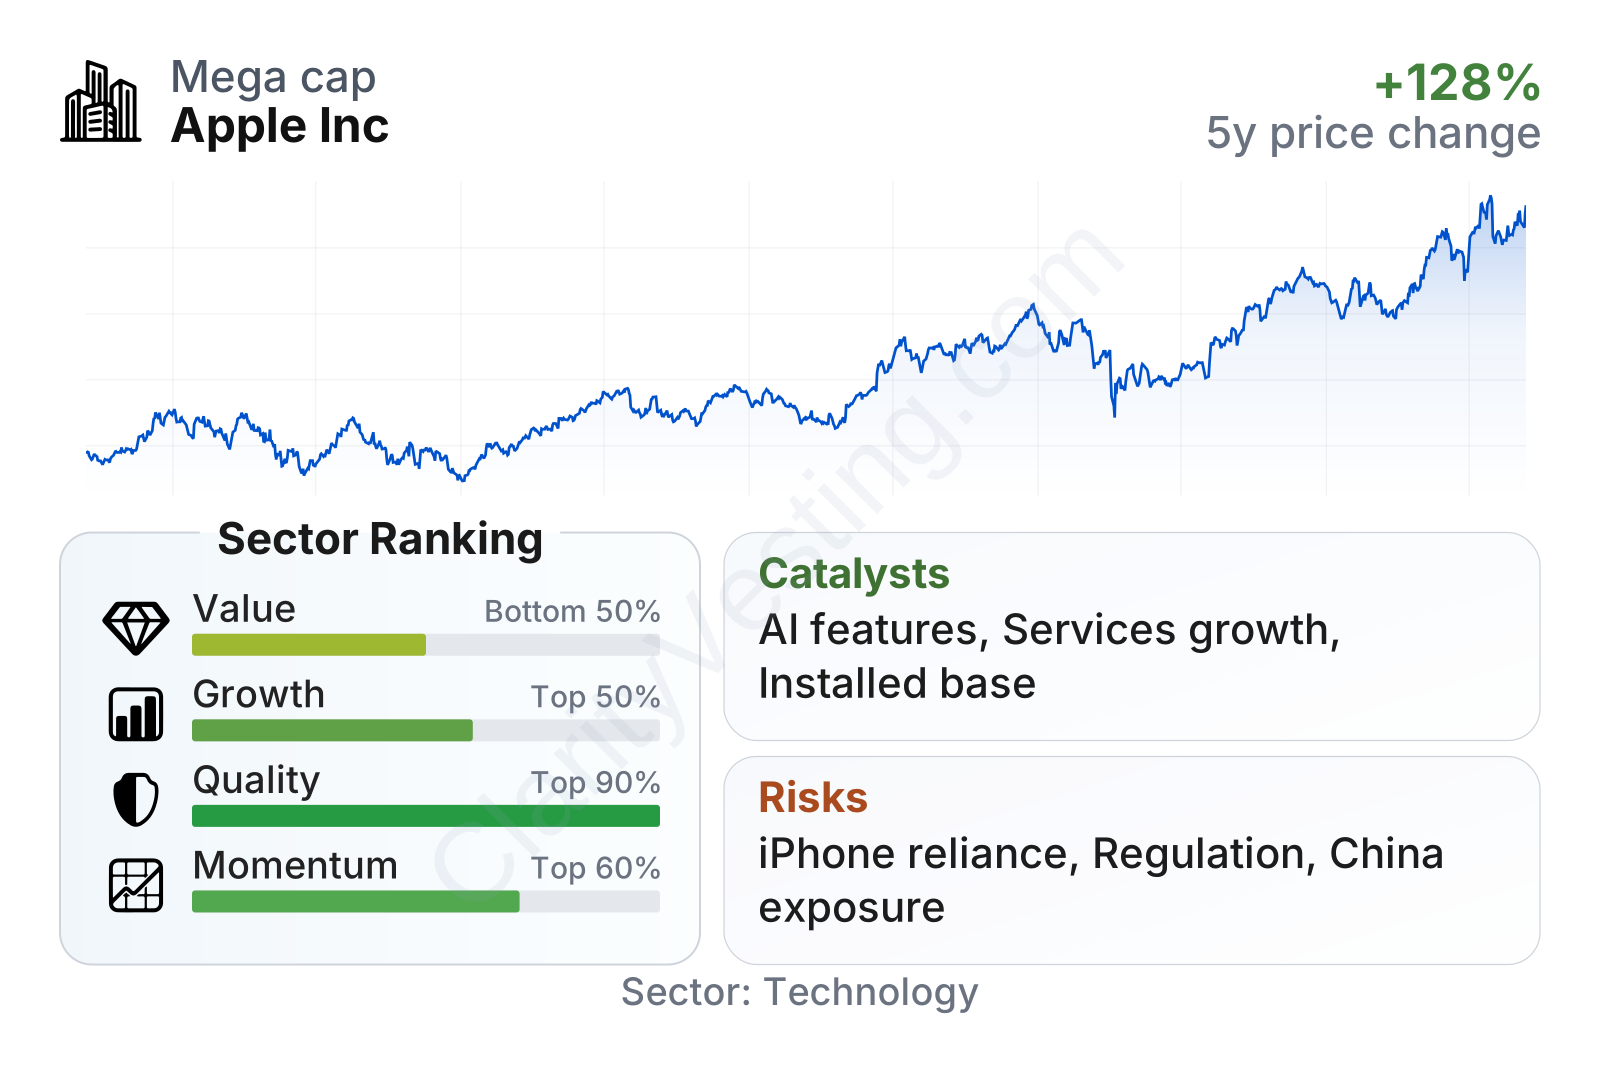
Apple sits among the largest listed companies in the market, with share-price behavior close to the broader equity market but still somewhat more volatile than a typical defensive business. The quality profile is especially strong: returns on invested capital are far above most technology peers, operating margins are well above sector norms, and profitability remains unusually resilient. Growth metrics are more mixed. Recent year-over-year revenue growth has reaccelerated into the mid-teens, which is better than the sector median, but longer-term free cash flow growth and revenue-per-share growth have been steadier than spectacular. On valuation, the stock trades at a premium to the sector on earnings and offers a lower free cash flow yield than the median, which points to a market that is already assigning meaningful value to Apple’s durability and earning power.
Growth
Apple operates in large markets that are still expanding, even if some of its core categories are mature. Smartphones and PCs do not offer the same easy growth they once did, but premium devices, connected wearables, digital services, on-device computing, semiconductors, and artificial intelligence remain important long-term areas. Apple’s position is strongest where hardware, software, and services reinforce each other rather than in stand-alone products.
The company’s strategy for future growth is coherent. It keeps users inside its ecosystem, adds recurring revenue through services, upgrades devices through custom chips and software, and extends the platform into adjacent categories. This matters because recurring activity from the installed base can reduce dependence on unit growth alone. In plain terms, Apple does not need every business line to grow rapidly if each customer spends more across devices, apps, subscriptions, storage, warranties, and accessories.
Recent revenue trends show a meaningful rebound after a softer period in 2023 and parts of 2024. Growth has recently been running in the mid-teens year over year, a clear improvement from the earlier stretch of flat or negative comparisons. That shift suggests Apple has regained momentum through a combination of product refreshes, services expansion, and a more favorable comparison base.
Cash generation has also strengthened. Free cash flow had been fairly stable around the $100 billion range for several years, then moved markedly higher more recently to well above that level. This is important because strong cash flow gives Apple room to fund research, build specialized chips, support its supply chain, and continue shareholder returns without putting strain on the core business.
One of the most important catalysts is Apple’s push into artificial intelligence features across its devices and software platforms. The company is emphasizing AI that works closely with its own hardware and operating systems, which fits its broader strategy of controlling the full user experience. If these features improve device replacement cycles, increase services engagement, or strengthen premium pricing, they could become a meaningful growth support rather than a separate business line.
Another catalyst is the continued expansion of services. Services revenue tends to be more recurring and often carries stronger margins than devices. As the installed base remains large and active, even modest increases in subscriptions, payments, cloud usage, advertising, and support plans can have an outsized impact on profit growth.
Risks
This article is for informational purposes only and does not constitute financial advice. Some content is AI-generated. See Disclaimer


